This topic describes how to query and analyze metric data in a Metricstore of Simple Log Service (SLS). This topic also describes how to configure the format of legend items in a time series chart.
Prerequisites
Metric data is collected.
Procedure
You can use only the PromQL syntax on the query and analysis page of a Metricstore. If you want to use the standard SQL syntax or the combination of SQL and PromQL, choose on the query and analysis page of the Metricstore to go to the query and analysis page of the Logstore that is automatically created for the Metricstore.
Log on to the Simple Log Service console.
In the Projects section, click the one you want.

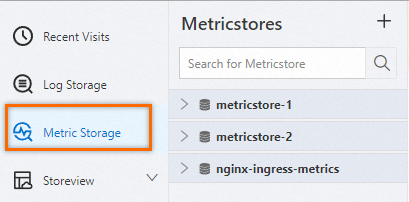
On the tab, click the metricstore you want.
In the upper-right corner of the page, click 15 Minutes(Relative) to specify a query time range.
NoteThe query and analysis results may contain metric data that is generated 1 minute earlier or later than the specified time range.
Execute a query statement.
Use the following methods to add a query statement:
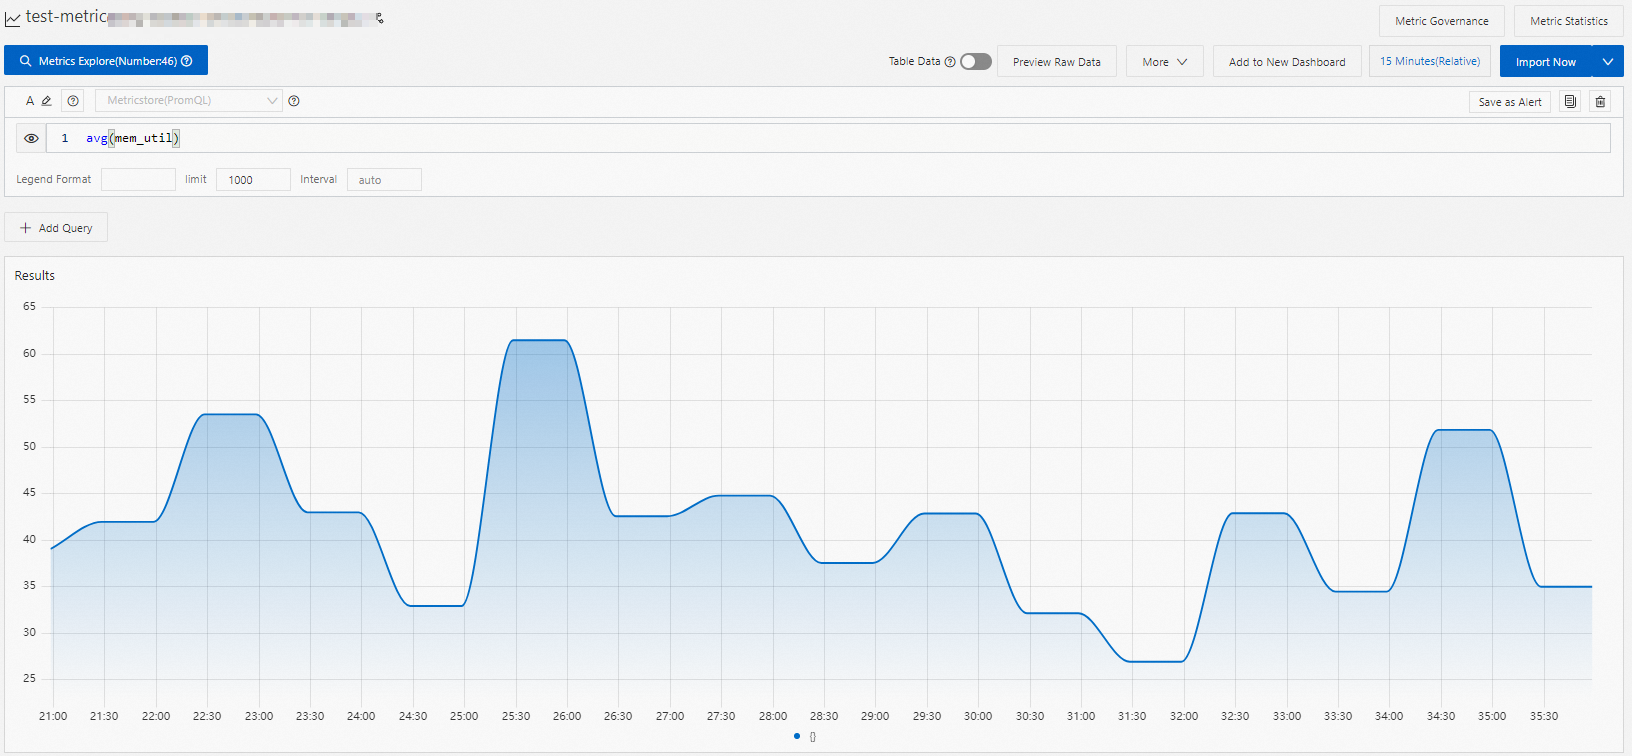
Enter a PromQL statement and click Execute Now.
You can add multiple query statements. SLS displays the results of multiple query statements in a time series chart.
Click Metrics Explore. In the dialog box that appears, find the metric that you want to use and click the
 icon in the Actions column. SLS automatically generates a query statement.
 In the dialog box of Metrics Explore, you can also find a metric and click Continue to Explore in the Actions column to specify label values. SLS automatically generates query statements based on your settings. For more information, see Metric exploration.
Verification of the PromQL syntax
If the automatic tree resolution feature is enabled, the system prompts information when you enter a PromQL statement. The information includes PromQL functions, aggregate functions, metric names, label keys, label values, and time ranges. For more information, see Prometheus documentation.
SLS also supports real-time syntax verification when you enter a PromQL statement.
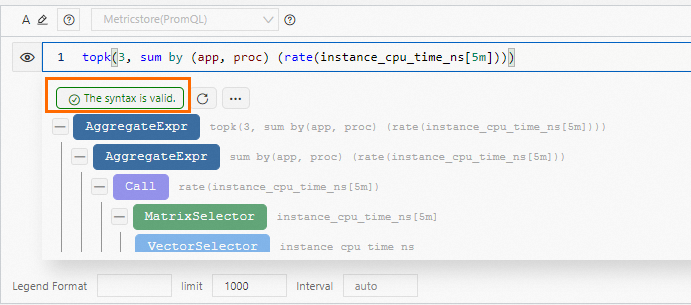
Correct syntax
If the message The syntax is valid. is displayed, the syntax passes the verification. A syntax parsing tree is generated.
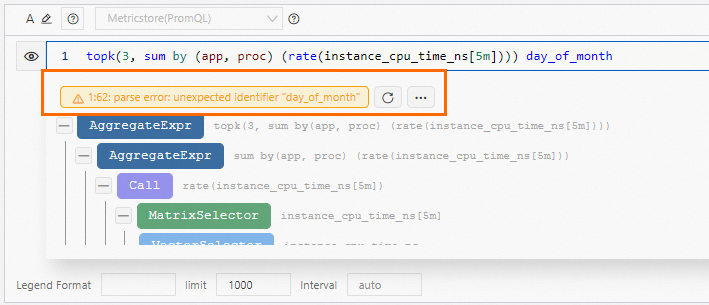
Incorrect syntax
If an error message is displayed, the syntax fails the verification. A syntax parsing tree is generated only for partial syntax, and the position and cause of the error are displayed.
During the verification, you can perform the following operations:
Click the
 icon to refresh the syntax parsing tree.
 Click the
 icon to display the node information about the syntax parsing tree.
 Click the
 or
or  icon to show or hide nodes.
 Click the
 or
or  icon to enable or disable the automatic tree resolution feature.
Metric exploration
After you click Metrics Explore, SLS displays metrics and allows you to configure the labels of the metrics. 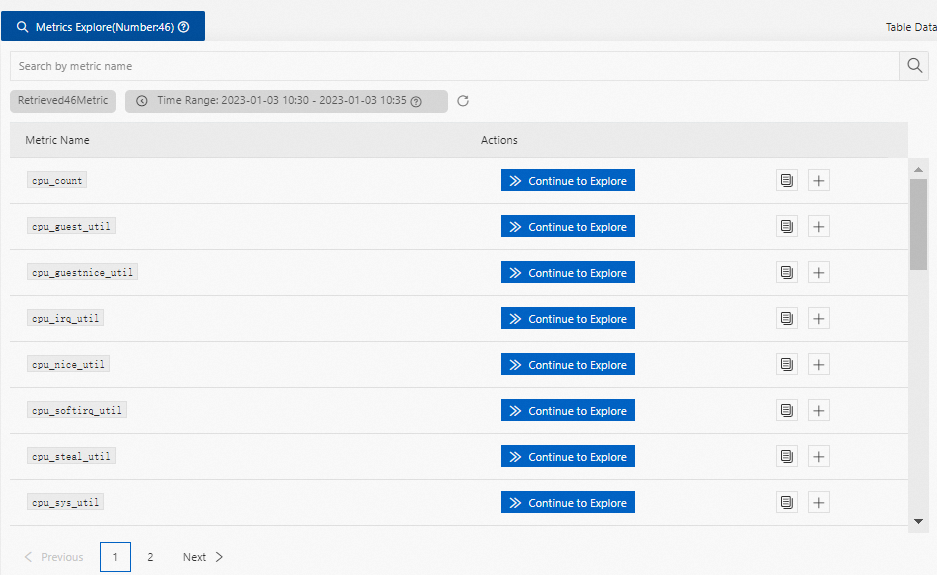
In the dialog box of Metrics Explore, you can perform the following operations:
Specify a query time range. The default query time range for metric exploration is the previous 5 minutes. This helps ensure the response speed. If the time interval of data in your Metricstore is large or you want to specify a custom time range, click Change to modify the time range
Click the
 icon to restore the query time range to the default setting.
 Filter metrics. Enter a metric name in the search box to filter metrics.
Copy a metric name. Click the
 icon to copy a metric name.
 Add a metric name to the field in which you can enter a query statement. Click the
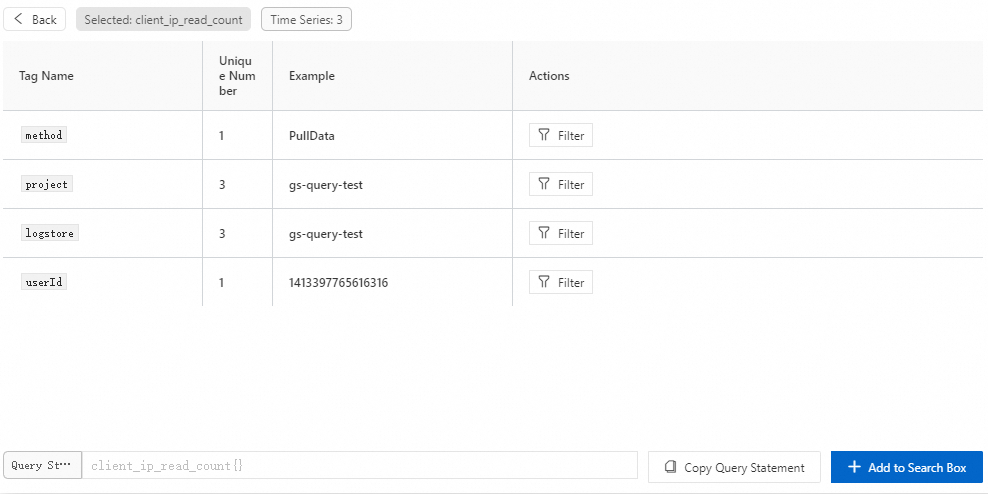
icon to add a metric name to the field. Continue to explore data. Click the Continue to Explore button to view the label data of a metric, including Tag Name, Unique Number, and Example.
Click Filter to specify label values. SLS supports four operators of the PromQL syntax for the filter mechanism. Select an operator and select or enter a filter condition. Regular expressions are supported.
After the configuration is complete, the system automatically displays a query statement that is generated based on the configuration. Click Copy Query Statement or Add to Search Box to execute the query statement.
Configure the format of legend items in a time series chart
After you execute a query statement, configure the display names of legend items in the time series chart.
The system automatically adjusts the step based on the query time range. You can also specify a custom step.
By default, the name of a legend item in a time series chart consists of a metric name and the labels of the metric. Use a variable to reference a label value as the name of a legend item. Format: {{Key of a label value}}. For example, a label is {ip="192.0.2.1"}. If you enter {{ip}} in the Legend Format field, the name of the legend item in the time series chart is displayed as 192.0.2.1. 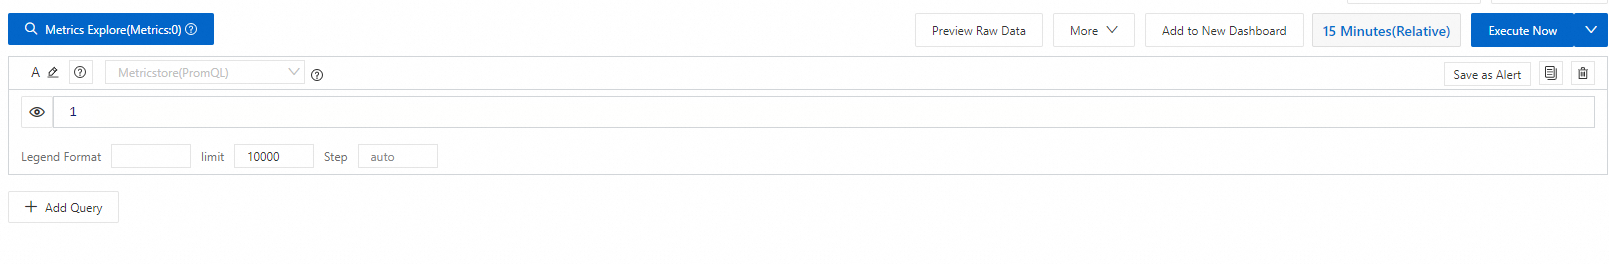
Other operations
Operation | Description |
Metric Statistics | Click Metric Statistics. You are redirected to the Metric Statistics dashboard. The dashboard displays the important statistics about the Metricstore, including the data volume, number of metrics, number of timelines, changes in data entries, and the quick location and comparison of top-level metrics. |
Metric Governance | Click Metric Governance. You are redirected to the Metric Governance dashboard. The dashboard displays the analysis results of time series changes for important metrics, changes of important metrics in time series charts, and summary statistics of metrics in dashboards. You can also view a solution that involves native statistics, data analysis, performance optimization, and exception diagnostics. |
Table Data | If you turn on Table Data, the system displays the query and analysis results in a table. |
Preview Raw Data | Click Preview Raw Data. The system displays the raw metric data. |
Data Transformation | Choose . For more information, see Overview of data transformation. |
Custom Analysis | Choose . You are redirected to the query and analysis page of the Logstore that is automatically created for the Metricstore. On this page, use the SQL syntax or the combination of SQL and PromQL to query data. |
Save as Scheduled SQL Job | Choose . Use the Scheduled SQL feature to process metric data and store the results to a Metricstore. For more information, see Process and save data from one metricstore to another. |
Add to New Dashboard | Click Add to New Dashboard. Add the query and analysis results to a dashboard. For more information, see Add a chart to a dashboard. After you add a time series chart to a dashboard, modify the attributes of the chart as needed. For more information, see Time series chart. |
Save as Alert | Click Save as Alert. Configure alerts for the query and analysis results. For more information, see Configure an alert rule. |
Copy | Click the |
Delete | Click the |
Refresh | Click the |
Share | Click |
 icon. Delete the section of the current query statement.
  icon. Copy the URL of the query and analysis page of the current Metricstore. Send the URL to other users who have permissions to view the Metricstore. The URL points to a query and analysis page that uses the settings of the original page at the time when you copy the URL.