This topic provides answers to some frequently asked questions about the monitoring dashboards of new-version jobs. The new-version jobs include Object Storage Service (OSS) data shipping jobs, MaxCompute data shipping jobs, and data import jobs.
What do I do if an error is reported on a job monitoring dashboard?
Description
When you open the Data Shipping Overview page of a job that belongs to a specific project, the The query failed error message is displayed, and no data is displayed in the report.
Cause
Job operational logs are stored in the Logstore named internal-diagnostic_log of the specified project. If the indexes of the Logstore are deleted or are not updated at the earliest opportunity, Simple Log Service cannot monitor the jobs of the specified project.
Solution
In the CloudLens for SLS application, find the job monitoring dashboard of the project in which job operational logs are stored and reconfigure indexes. For more information about how to determine the project in which job operational logs are stored, see Preparations.
- Log on to the Log Service console.
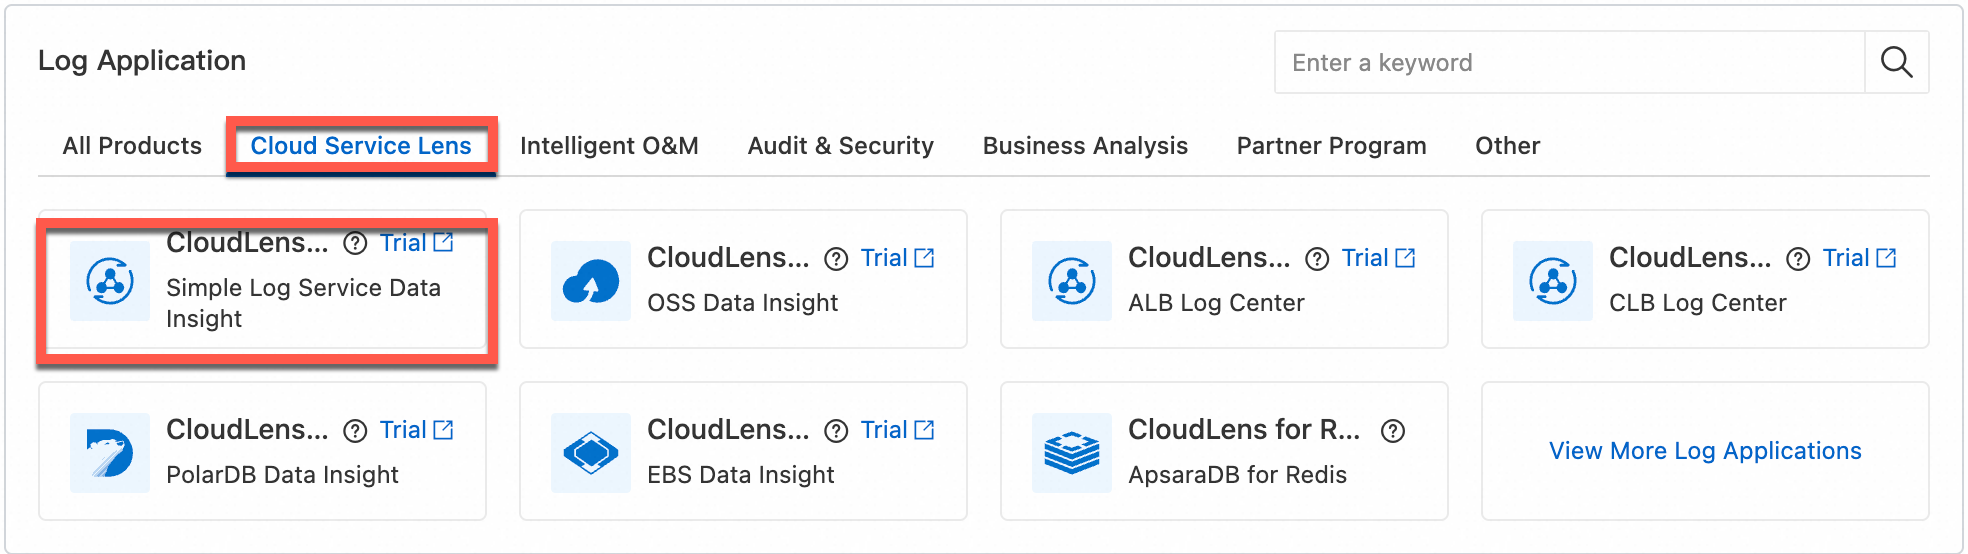
In the Log Application section, click the Cloud Service Lens tab. Then, click CloudLens for SLS.
In the left-side navigation pane, choose .
In the upper-left corner of the page that appears, find the project that you want to manage.
In the upper-right corner of the page, click Reset Indexes.

In the message that appears, click OK.
What do I do if no data is displayed on a job monitoring dashboard?
Description
When you open the Data Shipping Overview page of a job that belongs to a specific project, no data is displayed in the report.
Cause
If the collection feature of job operational logs is disabled for the specified project, Simple Log Service cannot monitor your job data, obtain the operational logs of your job, or display the operational logs on a job monitoring dashboard.
Solution
Find the project and enable the collection feature of job operational logs for the project.
We recommend that you use CloudLens for SLS to enable the feature for the project.
Procedure
- Log on to the Log Service console.
In the Log Application section, click the Cloud Service Lens tab. Then, click CloudLens for SLS.
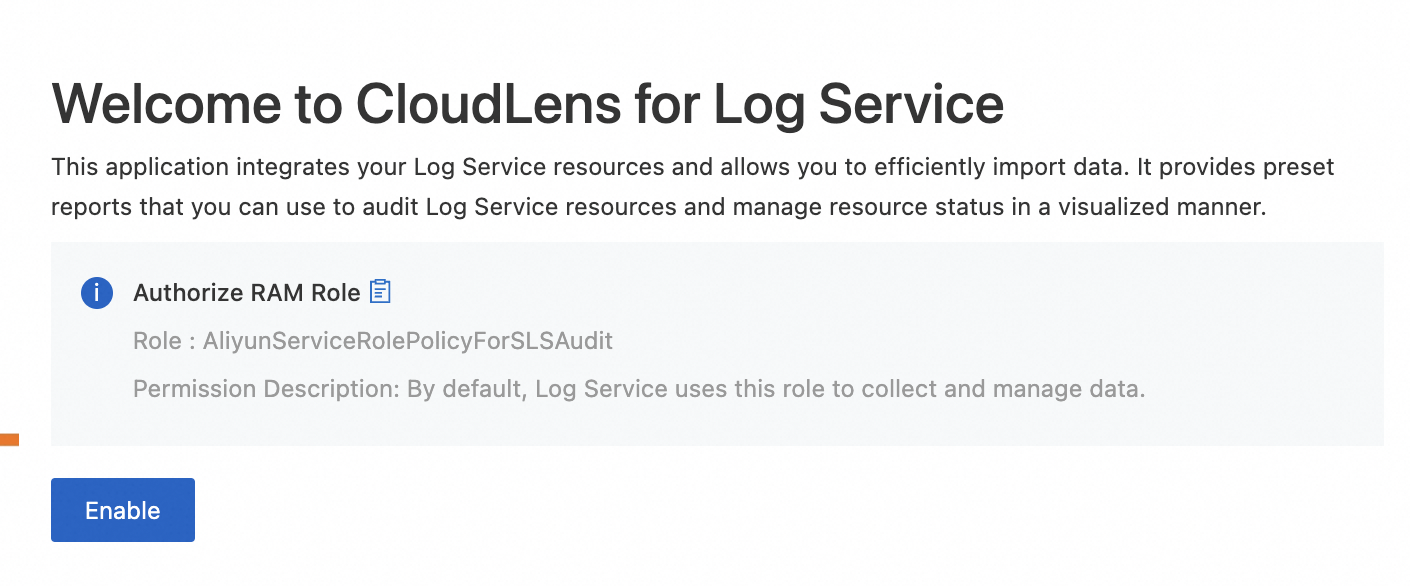
The following page is displayed. Click Enable and follow the instruction to enable the collection feature.
How do I view job operational logs?
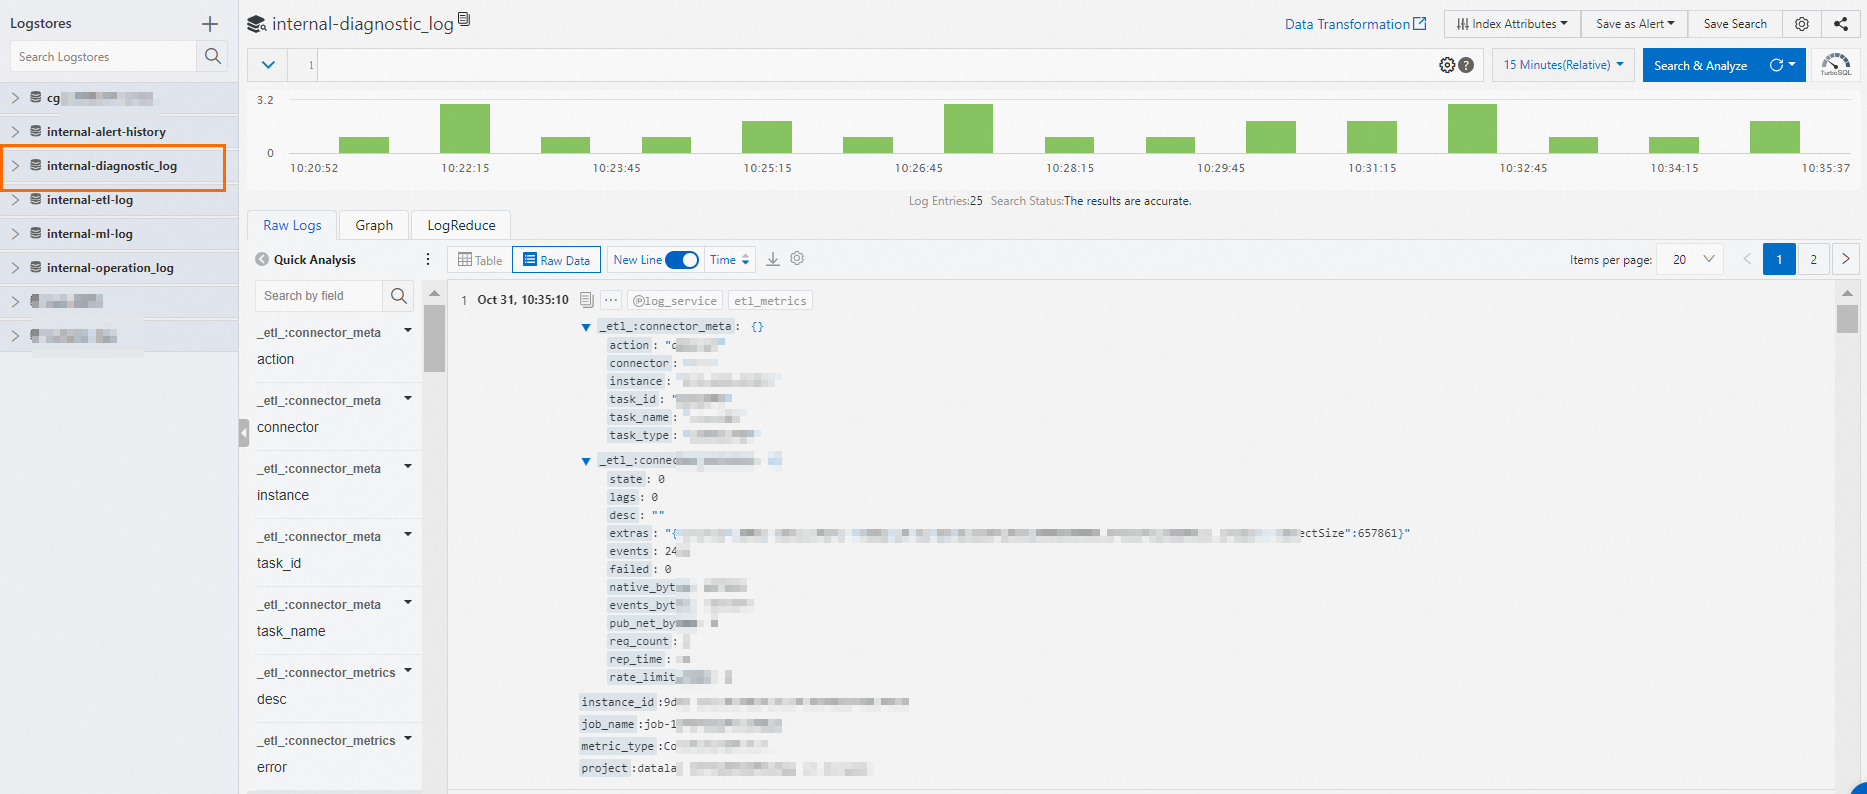
After you enable the collection feature of job operational logs, Simple Log Service stores the operational logs of new-version jobs to a Logstore named internal-diagnostic_log in the specified project. To view job operational logs in the Logstore, perform the following steps:
Log on to the Simple Log Service console.
In the Projects section, click the project that you want to manage.
In this example, click the project for which the collection feature of job operational logs is enabled.
In the tab, click internal-diagnostic_log.
View the operational logs of your job.
You can also query job operational logs by job name. Supported query statements must be in the
job_name:<Job name>format. Example:job_name:job-1646****946.For more information about the fields in job operational logs, see Operational logs of data import jobs and data shipping jobs.