Data monitoring for Kubernetes Java virtual machines (JVMs) is a flexible and end-to-end metric collection solution for all JVM-based services in Kubernetes clusters. Data monitoring is supported on top of Kubernetes-adapted Logtail configurations and automatic service discovery.
Prerequisites
A Full-stack Observability instance is created. For more information, see Create an instance.
Implementation
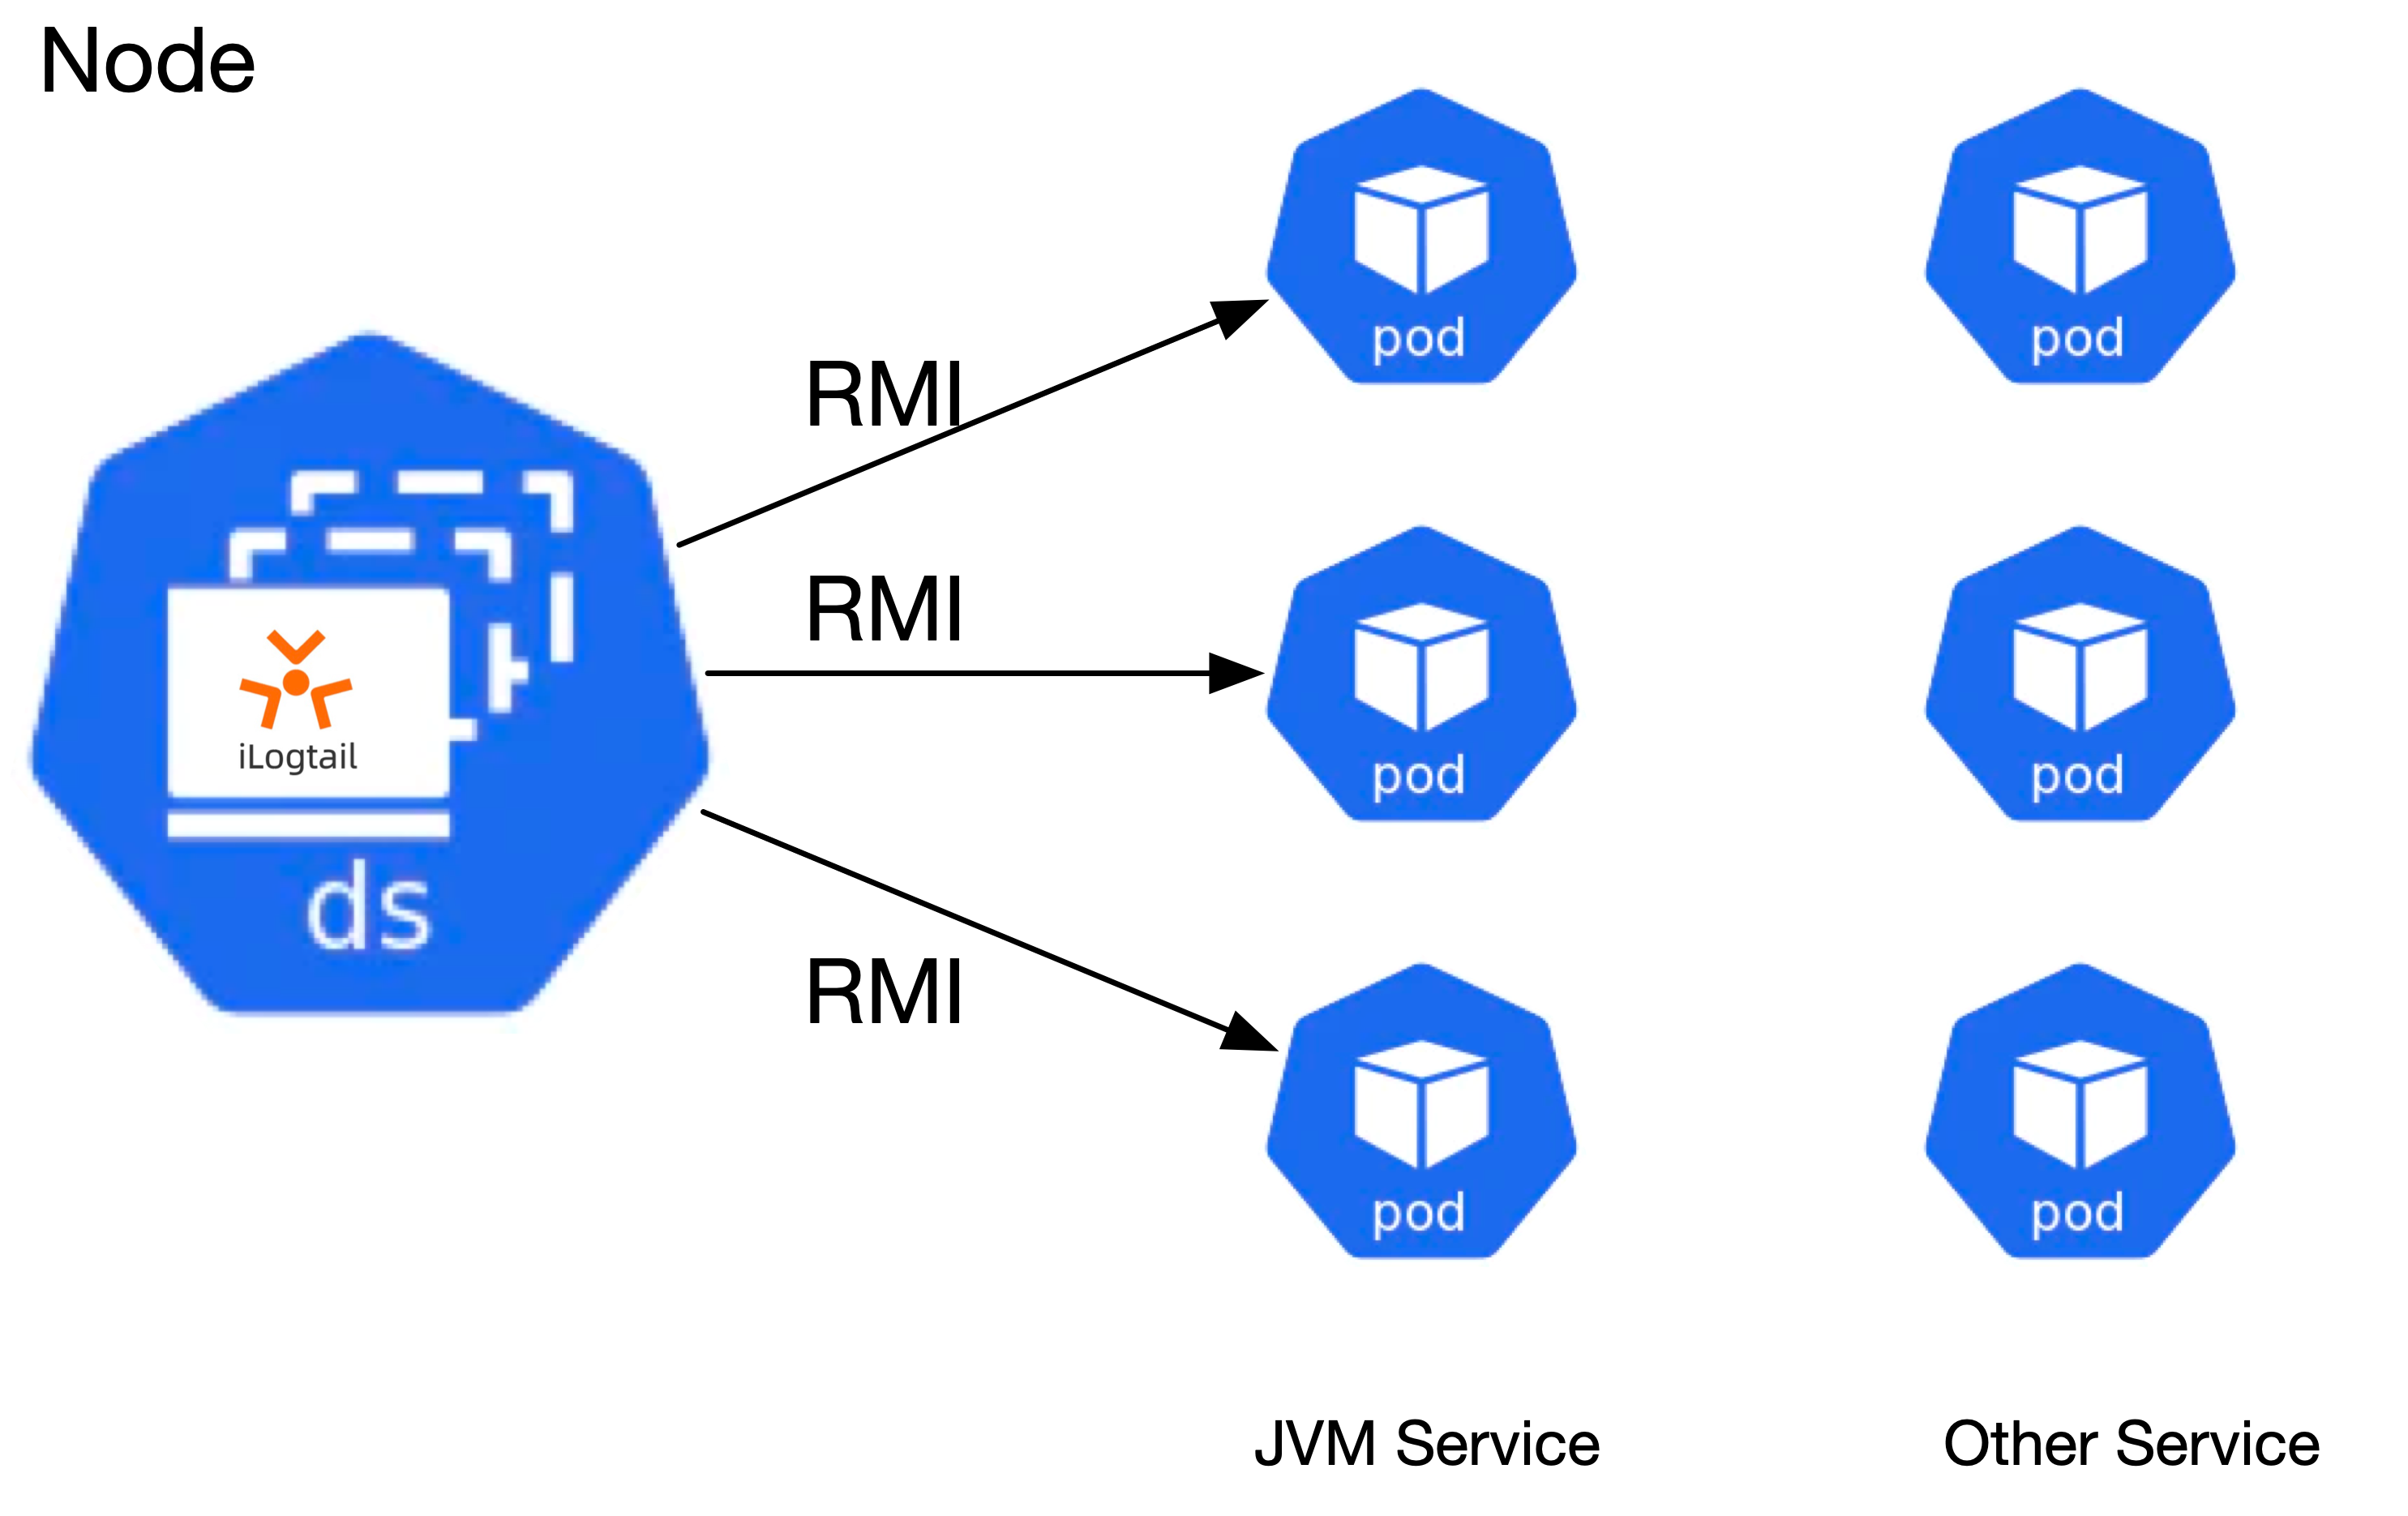
The Java Management Extensions (JMX) technology is a standard part of the Java SE platform. JMX is mainly used to monitor and manage information such as the status of Java applications and JVM servers and resources. JMX supports Remote Method Invocation (RMI) for data ingestion, which functions in a way similar to a Prometheus exporter. Metric read is more secure and data integration is more cost-effective by calling RMI than by using a Java agent.
In Kubernetes clusters, the DaemonSet deployment model is used for both JVM metric collection and log collection components. When you collect monitoring data from JVMs, you can filter the data by using environment variables, Kubernetes labels, namespaces, pod names, and container names. Data filtering is implemented by using log collection components that support multi-dimensional selection of Kubernetes resources. RMI requires communication between Java processes, and Kubernetes resource selection may hit a large number of unrelated processes. In this case, Logtail uses the environment variable ILOGTAIL_JMX_PORT to further narrow the scope of data.
Before you begin
If you want to use Logtail to automatically collect monitoring data from JVMs for Java applications deployed in Kubernetes clusters, you must perform the following operations:
Add the POD_IP declaration to your environment variables.
Example:
            - name: POD_IP
              valueFrom:
                fieldRef:
                  fieldPath: status.podIP
Configure JVM startup parameters.
Configure the following com.sun.management.jmxremote parameters to enable JMX remote access:
Set the com.sun.management.jmxremote.local.only parameter to false.
Set both the com.sun.management.jmxremote.ssl and com.sun.management.jmxremote.authenticate parameters to false or configure the JMX Password parameter in your Logtail configuration.
Set the com.sun.management.jmxremote.port and com.sun.management.jmxremote.rmi.port parameters to the declared RMI port.
Set the java.rmi.server.hostname parameter to the value of the POD_IP environment variable.
   -Dcom.sun.management.jmxremote
    -Dcom.sun.management.jmxremote.authenticate=false
    -Dcom.sun.management.jmxremote.ssl=false
    -Dcom.sun.management.jmxremote.local.only=false
    -Dcom.sun.management.jmxremote.port=9999
    -Dcom.sun.management.jmxremote.rmi.port=9999
    -Djava.rmi.server.hostname=$(POD_IP)
Add the ILOGTAIL_JMX_PORT declaration to your environment variables. The declaration specifies the exposed metric port and is indicated by the value of the
com.sun.management.jmxremote.portparameter.After you complete the preceding operations, you can connect to the required pod and run the jps command to view JVM startup parameters. The
JAVA_TOOL_OPTIONS=""declaration in the jps command is used to avoid port conflicts. If the environment variable JAVA_TOOL_OPTIONS is used when you run the jps command, port conflicts may occur.
Verify the environment variable: Connect to the required pod and run the
env|grep ILOGTAIL_JMX_PORTcommand.
Procedure
Log on to the Simple Log Service console.
In the Log Application section, click the Intelligent O&M tab. Then, click Full-stack Observability.
On the Simple Log Service Full-stack Observability page, click the instance that you want to manage.
In the left-side navigation pane, click Full-stack Monitoring.
The first time you use Full-stack Monitoring in the instance, click Enable.
In the left-side navigation pane, click Data Import. On the Data Import Configurations page, find the Kubernetes JVM Monitoring switch in the Kubernetes Monitoring section.
The first time you create a Logtail configuration for host monitoring data, turn on the switch to go to the configuration page. If you created a Logtail configuration, click the
 icon to go to the configuration page.
 Click Use Existing Machine Groups.
After the monitoring component is installed, Simple Log Service automatically creates a machine group whose name is in the
k8s-group-${your_k8s_cluster_id}format. You can use this machine group.Select the
k8s-group-${your_k8s_cluster_id}machine group, move the machine group from the Source Server Groups section to the Applied Server Groups section, and then click Next.ImportantIf the heartbeat status of the machine group is FAIL, you can click Automatic Retry. If the issue persists, see What do I do if a Logtail machine group has no heartbeats?
In the Specify Data Source step, configure the parameters and click Complete. The following table describes the parameters.
After you complete the configuration, Simple Log Service automatically creates assets such as Metricstores.
Parameter
Description
General configurations
Config Name
The name of the Logtail configuration. You can specify a custom name.
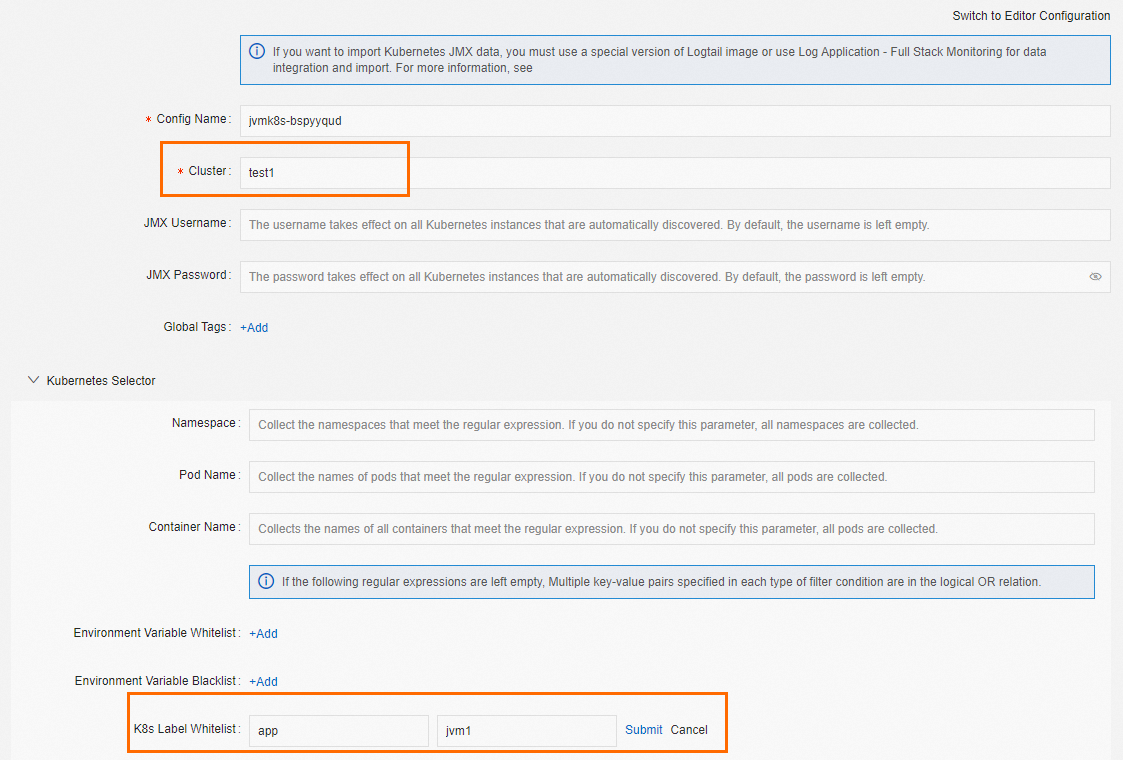
Cluster
The name of the Kubernetes cluster. You can enter a custom name.
After you configure this parameter, Simple Log Service adds a
cluster=Cluster nametag to the Kubernetes JVM monitoring data that is collected by using the Logtail configuration.ImportantMake sure that the cluster name is unique. Otherwise, data conflicts may occur.
JMX Username
The username that is used to access the JMX server.
We recommend that you do not configure this parameter in Kubernetes clusters.
JMX Password
The password that is used to access the JMX server.
We recommend that you do not configure this parameter in Kubernetes clusters.
Global Tags
The custom tags that are added to the collected Kubernetes JVM monitoring data. The tags are key-value pairs.
After you configure this parameter, Simple Log Service adds the custom tags to the JVM monitoring data that is collected by using the Logtail configuration.
Configurations for K8s Selector
Namespace
The regular expression used to match the names of namespaces from which data is collected.
Pod Name
The regular expression used to match the names of pods from which data is collected.
Container Name
The regular expression used to match the names of containers from which data is collected.
Environment Variable Whitelist
The environment variable whitelist. The whitelist specifies the containers from which data can be collected. By default, this parameter is empty, which indicates that the system collects JVM monitoring data from all containers. When you configure the environment variable whitelist, the Key parameter is required. The value parameter is optional.
If the EnvValue parameter is empty, containers whose environment variables contain the keys specified by EnvKey are matched.
If the EnvValue parameter is not empty, containers whose environment variables consist of the key-value pairs specified by EnvKey and EnvValue are matched.
By default, string matching is performed for the values of the EnvValue parameter. Containers are matched only if the values of the environment variables are the same as the values of the EnvValue parameter. If you specify a value that starts with a caret (
^) and ends with a dollar sign ($) for the EnvValue parameter, regular expression matching is performed. For example, if you set the EnvKey parameter to NGINX_SERVICE_PORT and set the EnvValue parameter to ^(80|6379)$, containers whose port number is 80 and containers whose port number is 6379 are matched.
Key-value pairs are connected by using the OR operator. If a container has an environment variable that consists of one of the specified key-value pairs, the container is matched.
Environment Variable Blacklist
The environment variable blacklist. The blacklist specifies the containers from which data cannot be collected. By default, this parameter is empty, which indicates that the system collects data from all containers. When you configure the environment variable blacklist, the Key parameter is required. The value parameter is optional.
If the EnvValue parameter is empty, containers whose environment variables contain the keys specified by EnvKey are filtered out.
If the EnvValue parameter is not empty, containers whose environment variables consist of the key-value pairs specified by EnvKey and EnvValue are filtered out.
By default, string matching is performed for the values of the EnvValue parameter. Containers are matched only if the values of the environment variables are the same as the values of the EnvValue parameter. If you specify a value that starts with a caret (
^) and ends with a dollar sign ($) for the EnvValue parameter, regular expression matching is performed. For example, if you set the EnvKey parameter to NGINX_SERVICE_PORT and set the EnvValue parameter to ^(80|6379)$, containers whose port number is 80 and containers whose port number is 6379 are matched.
Key-value pairs are connected by using the OR operator. If a container has an environment variable that consists of one of the specified key-value pairs, the container is filtered out.
K8s Label Whitelist
The Kubernetes label whitelist. The whitelist specifies the containers from which data cannot be collected. When you configure the Kubernetes label whitelist, the Key parameter is required, and the value parameter is optional.
If the LabelValue parameter is empty, containers whose Kubernetes labels contain the keys specified by LabelKey are matched.
If the LabelValue parameter is not empty, containers whose Kubernetes labels consist of the key-value pairs specified by LabelKey and LabelValue are matched.
By default, string matching is performed for the values of the LabelValue parameter. Containers are matched only if the values of the Kubernetes labels are the same as the values of the LabelValue parameter. If you specify a value that starts with a caret (
^) and ends with a dollar sign ($), regular expression matching is performed. For example, if you set the LabelKey parameter to app and set the LabelValue parameter to ^(test1|test2)$, containers whose Kubernetes labels consist of app:test1 or app:test2 are matched.
Key-value pairs are connected by using the OR operator. If a container has a Kubernetes label that consists of one of the specified key-value pairs, the container is matched.
K8s Label Blacklist
The Kubernetes label blacklist. The blacklist specifies the containers from which data cannot be collected. When you configure the Kubernetes label blacklist, the Key parameter is required, and the value parameter is optional.
If the LabelValue parameter is empty, containers whose Kubernetes labels contain the keys specified by LabelKey are filtered out.
If the LabelValue parameter is not empty, containers whose Kubernetes labels consist of the key-value pairs specified by LabelKey and LabelValue are filtered out.
By default, string matching is performed for the values of the LabelValue parameter. Containers are matched only if the values of the Kubernetes labels are the same as the values of the LabelValue parameter. If you specify a value that starts with a caret (
^) and ends with a dollar sign ($), regular expression matching is performed. For example, if you set the LabelKey parameter to app and set the LabelValue parameter to ^(test1|test2)$, containers whose Kubernetes labels consist of app:test1 or app:test2 are matched.
Key-value pairs are connected by using the OR operator. If a container has a Kubernetes label that consists of one of the specified key-value pairs, the container is filtered out.
Container Label Whitelist
The container label whitelist. The whitelist specifies the containers from which data can be collected. By default, this parameter is empty, which indicates that the system collects JVM monitoring data from all containers. When you configure the container label whitelist, the Key parameter is required. The value parameter is optional.
If the LabelValue parameter is empty, containers whose container labels contain the keys specified by LabelKey are matched.
If the LabelValue parameter is not empty, containers whose container labels consist of the key-value pairs specified by LabelKey and LabelValue are matched.
By default, string matching is performed for the values of the LabelValue parameter. Containers are matched only if the values of the container labels are the same as the values of the LabelValue parameter. If you specify a value that starts with a caret (
^) and ends with a dollar sign ($) for the LabelValue parameter, regular expression matching is performed. For example, if you set the LabelKey parameter to io.kubernetes.container.name and set the LabelValue parameter to ^(nginx|cube)$, a container named nginx and a container named cube are matched.
Key-value pairs are connected by using the OR operator. If a container has a container label that consists of one of the specified key-value pairs, the container is matched.
Container Label Blacklist
The container label blacklist. The blacklist specifies the containers from which data cannot be collected. By default, this parameter is empty, which indicates that you want to collect data from all containers. When you configure the container label blacklist, the Key parameter is required. The value parameter is optional.
If the LabelValue parameter is empty, containers whose container labels contain the keys specified by LabelKey are filtered out.
If the LabelValue parameter is not empty, containers whose container labels consist of the key-value pairs specified by LabelKey and LabelValue are filtered out.
By default, string matching is performed for the values of the LabelValue parameter. Containers are matched only if the values of the container labels are the same as the values of the LabelValue parameter. If you specify a value that starts with a caret (
^) and ends with a dollar sign ($) for the LabelValue parameter, regular expression matching is performed. For example, if you set the LabelKey parameter to io.kubernetes.container.name and set the LabelValue parameter to ^(nginx|cube)$, a container named nginx and a container named cube are matched.
Key-value pairs are connected by using the OR operator. If a container has a container label that consists of one of the specified key-value pairs, the container is filtered out.
Advanced configurations
Collect Kubernetes Labels
After Kubernetes labels are configured, Simple Log Service adds Kubernetes label-related fields to the collected JVM monitoring data.
For example, set the name of the label to
appand the alias of the name tok8s_label_app. If a Kubernetes cluster contains a label namedapp, such asapp=serviceA, Simple Log Service adds the fieldk8s_label_app: serviceAto the JVM monitoring data.Collect Environment Variable
After environment variable labels are configured, Simple Log Service adds environment variable label-related fields to the collected JVM monitoring data.
For example, if you set the name of the environment variable to
VERSIONand the alias of the name toenv_version, a container contains an environment variable namedVERSION, such asVERSION=v1.0.0and Simple Log Service adds the fieldenv_version: v1.0.0to the JVM monitoring data.JMX Garbage Collector of New Version
After you turn on the switch, JMX garbage collectors of the new versions such as G1 are supported.
Default JVM Metrics
After you turn on the switch, Logtail collects predefined core JVM metrics.
JMX Metric Collection Filter
The filtering and collection by using JMX bean ranges, JMX bean regular expressions, JMX bean types, and JMX attribute ranges are supported.
Configuration example
For example, you can start the SpringBoot Demo service in a namespace named default. Then, you can use the ILOGTAIL_JMX_PORT declaration to expose port 9999. In the environment variable JAVA_TOOL_OPTIONS, you can add JVM startup parameters for JMX metrics that correspond to the exposed port 9999.
Before you use the environment variable JAVA_TOOL_OPTIONS to reference the environment variable POD_IP, you must define the environment variable POD_IP.
apiVersion: apps/v1
kind: Deployment
metadata:
name: jvm-new-1
namespace: default
spec:
...
template:
metadata:
labels:
app: jvm1
spec:
containers:
- image: evanljp/full-stack:jvm-new-0.1
name: jvm
env:
- name: "ILOGTAIL_JMX_PORT"
value: "9999"
- name: "ILOGTAIL_JMX_TAGS"
value: "a=b,c=d"
- name: POD_IP
valueFrom:
fieldRef:
fieldPath: status.podIP
- name: JAVA_TOOL_OPTIONS
value: >-
-Dcom.sun.management.jmxremote
-Dcom.sun.management.jmxremote.authenticate=false
-Dcom.sun.management.jmxremote.ssl=false
-Dcom.sun.management.jmxremote.local.only=false
-Dcom.sun.management.jmxremote.port=9999
-Dcom.sun.management.jmxremote.rmi.port=9999
-Djava.rmi.server.hostname=$(POD_IP)
-Dserver.port=8081
...
After you specify the preceding declarations, you need to complete the following settings in your Logtail configuration to collect monitoring data from Kubernetes JVMs to Simple Log Service.
What to do next
After Kubernetes JVM monitoring data is collected and sent to the Full-stack Monitoring application, the application automatically creates dedicated dashboards for the monitoring data. You can use the dashboards to analyze the monitoring data. For more information, see View dashboards.