Time series charts are designed for Metricstores. A time series chart displays the results of one or more queries on data that is collected from Prometheus and stored to a Metricstore. This topic describes how to configure a time series chart.
Introduction
A time series chart is used to analyze the value changes in a group of data over a continuous time range. You can use a time series chart to analyze the following change characteristics of values over a specific time range:
Increment or decrement
Increment or decrement rate
Increment or decrement pattern, such as periodicity
Peak value and bottom value
Time series charts are the optimal choice for you to analyze value changes over a time range. You can also use a time series chart to analyze the value changes of multiple categorical variables in multiple lines over the same time range. This allows you to analyze the relationships between the categorical variables. For example, the values of a categorical variable are proportional or inversely proportional to the values of another categorical variable. You can also use a time series chart to compare the value of a categorical variable at a specific point in time with the value of the categorical variable at the current point in time.
Common Settings tab
On the Common Settings tab, you can configure global settings for the time series chart.
Basic Configurations section
Parameter
Description
Title
The title of the time series chart.
Show Title
If you turn on Show Title, the title of the time series chart is displayed.
Show Border
If you turn on Show Border, the borders of the time series chart are displayed.
Show Background
If you turn on Show Background, the background color of the time series chart is displayed.
Show Time
If you turn on Show Time, the query time range of the time series chart is displayed.
Fixed Time
If you turn on Fixed Time, the specified time range remains unchanged regardless of whether the global time range of the dashboard changes.
Standard Configurations section
Parameter
Description
Format
The display format of numeric values.
Unit
The unit of numeric values.
Number of Digits after Decimal Point
The number of digits after the decimal point of numeric values.
Display Name
The name of the legend entries.
If you specify a display name, the name of each legend entry is changed to the display name. If you want to change the name of a legend entry, you can configure the name on the Fields tab.
Color Scheme
The color scheme of the time series chart. The color scheme is applied to the background and legend entries of the time series chart.
Built-in: uses the built-in color scheme.
Solid: uses the color that you select.
Data Configuration section
Parameter
Description
Data Completion
When enabled, Simple Log Service fills in missing data points within the specified Completion Window. You can specify the value used for filling in the Text-substituted Value parameter.
Completion Window
The time window of data for which Simple Log Service automatically replaces missing values with a specific value. Minimum value: 0. Unit: seconds.
By default, Simple Log Service automatically specifies the value of the Completion Window parameter.
Text-substituted Value
The value that you want to use to replace missing values. Default value: 0. This value indicates that Simple Log Service replaces missing values with 0.
Legend Configurations section
Parameter
Description
Display Legend
If you turn on Display Legend, the legend is displayed in the time series chart.
Legend
The position of the legend in the time series chart.
Actions
The method that is used to display the data of legend entries.
Single: If you click a legend entry, only the data of the legend entry is displayed in the time series chart.
Switch: If you click a legend entry, the data of the legend entry is hidden or displayed in the time series chart.
Maximum Width (Height)%
The maximum width and height of the legend.
Tooltip Configurations section
Parameter
Description
Sorting Order
The sorting method of data.
Display Mode
The display mode of data.
When you move the pointer over the time series chart, the data is displayed based on the display mode that you specified.
Axis X section
Parameter
Description
Display Axis X
If you turn on Display Axis X, the x-axis of the time series chart is displayed.
Axis X Title
The title of the x-axis.
Format
The format of the values on the x-axis.
Axis X Height
The height of the x-axis.
By default, Simple Log Service automatically specifies the height of the x-axis
Drag and Zoom
The global time or the current single chart time is refreshed after you drag and zoom a specific part of the chart.
Axis Y section
Parameter
Description
Display Axis Y
If you turn on Display Axis Y, the y-axis of the time series chart is displayed.
Axis Y Title
The title of the y-axis.
Axis Y Position
The position of the y-axis.
Stacking
If you set the Stacking parameter to Yes, the data on the y-axis is stacked.
Axis Y Width
The width of the y-axis.
By default, Simple Log Service automatically specifies the width of the y-axis.
Max Value
The maximum value that can be displayed on the y-axis.
By default, Simple Log Service automatically specifies the maximum value of the y-axis.
Minimum
The minimum value that can be displayed on the y-axis.
By default, Simple Log Service automatically specifies the minimum value of the y-axis.
Elastic Minimum Value
The elastic minimum value of the y-axis. The elastic minimum value takes effect only when all values of the y-axis are greater than the elastic minimum value.
By default, Simple Log Service automatically specifies the elastic minimum value of the y-axis.
Elastic Maximum Value
The elastic maximum value of the y-axis. The elastic maximum value takes effect only when all values of the y-axis are less than the elastic maximum value.
By default, Simple Log Service automatically specifies the elastic maximum value of the y-axis.
Axis Y ID
The ID of the y-axis. In most cases, this parameter does not take effect if you configure only one y-axis on the Common Settings tab. If you want to configure multiple y-axes, you must configure the required parameters on the Fields tab. The ID of the y-axis is a string. A y-axis that has a specified ID represents a unique y-axis in the time series chart. For more information, see Create a line chart with multiple y-axes.
The specified ID for the y-axis takes precedence over the unit that you specify in the Standard Configurations section. For example, if two y-axes have the same unit, they are merged into one y-axis. If two y-axes have the same unit but different IDs, they are displayed as two y-axes.
Chart Configurations section
Parameter
Description
Chart Type
The type of the time series chart.
Connection Mode
The connection mode of the lines in the time series chart.
Connector Width
The width of the lines in the time series chart.
Show Points
Specifies whether to display points in the chart.
Transparency
The transparency of the time series chart.
Point Size
The size of the points in the time series chart.
Gradient Mode
The gradient mode of the time series chart.
Transparency: The gradient is based on the line color and the value of the Transparency parameter.
No Gradient: No gradient is used. The column color is based on the setting of the Color Scheme parameter.
Threshold section
Parameter
Description
Upper Boundary
The upper boundary.
Lower Boundary
The lower boundary.
Boundary Fill Color
The fill color between the upper and lower boundaries.
Boundary Fill Color Opacity
The opacity of the color between the upper and lower boundaries.
Parameters in the Variable Replacement section
Parameter
Description
Variable Replacement
The settings for variable replacement. You can click AddVariable Replacement to add a filter of the Variable Replacement type to the table. After you configure the settings for variable replacement on the General Configurations tab, Simple Log Service adds a filter in the upper-left corner of the table. You can select a value from the filter drop-down list. Then, Simple Log Service automatically replaces the variable in the query statement of the table with the variable value indicated by the value that you select, and performs a query and analysis operation. For more information, see Example 2: Configure variable replacement.
Documentation section
Parameter
Description
Add Documentation Link
The button that can be used to specify custom documentation links and descriptions. After you configure the settings, a documentation icon is displayed in the upper-right corner of the cross table.
Fields tab
You can configure custom display settings for the result of a single query statement or for a single column in the result. For information about the parameters on the Fields tab, see Common Settings tab.
The following time series chart shows the CPU utilization of different hosts over time. Each line represents a host. If you want to specify a custom color for each line, you can configure settings on the Fields tab. 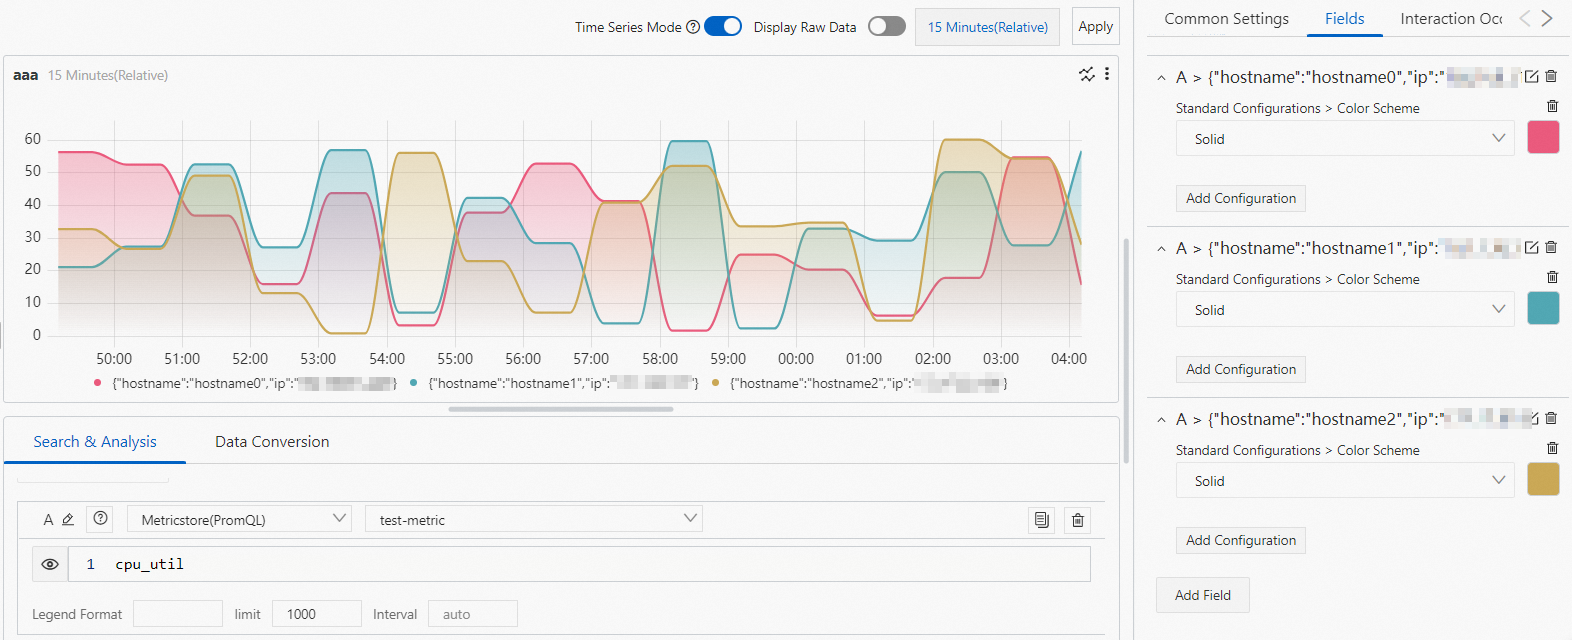
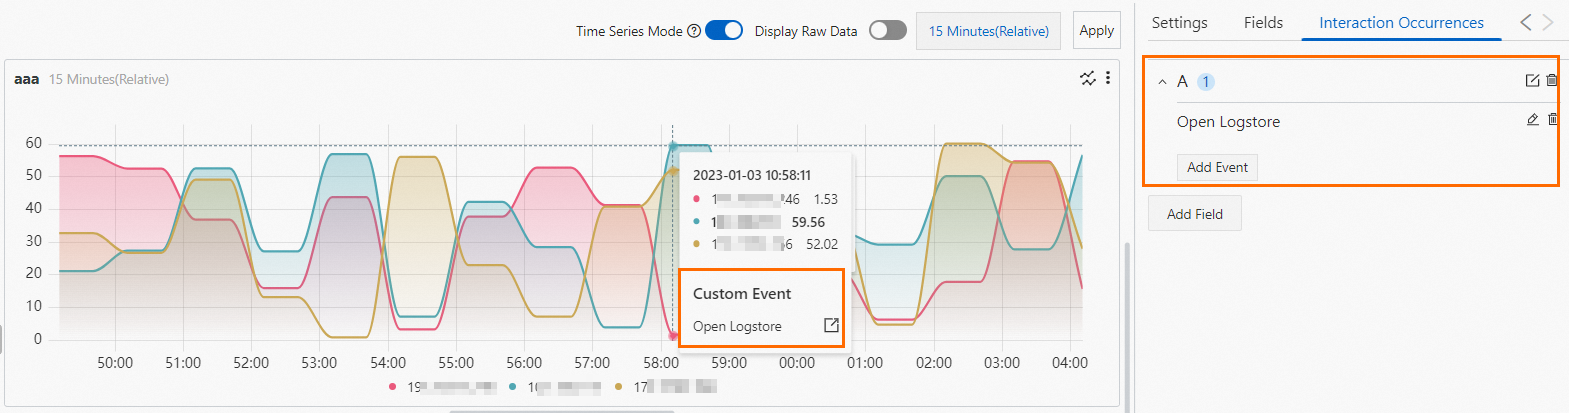
Interaction Occurrences tab
Interaction occurrences are used to drill down a single field or the result of a single query statement to obtain finer-grained data. You can configure the following interaction occurrences: Open Logstore, Open Saved Search, Open Dashboard, Open Trace Analysis, Open Trace Details, and Create Custom HTTP URL. For more information, see Drill-down events.
In this example, the A field is added to configure an interaction occurrence for the result of Query Statement A. For example, you can add the A field to configure an Open Logstore interaction occurrence for the result of Query Statement A. After you configure the interaction occurrence, click a point on the line and click Open Logstore. Then, you are redirected to the Logstore that you specified in the interaction occurrence.
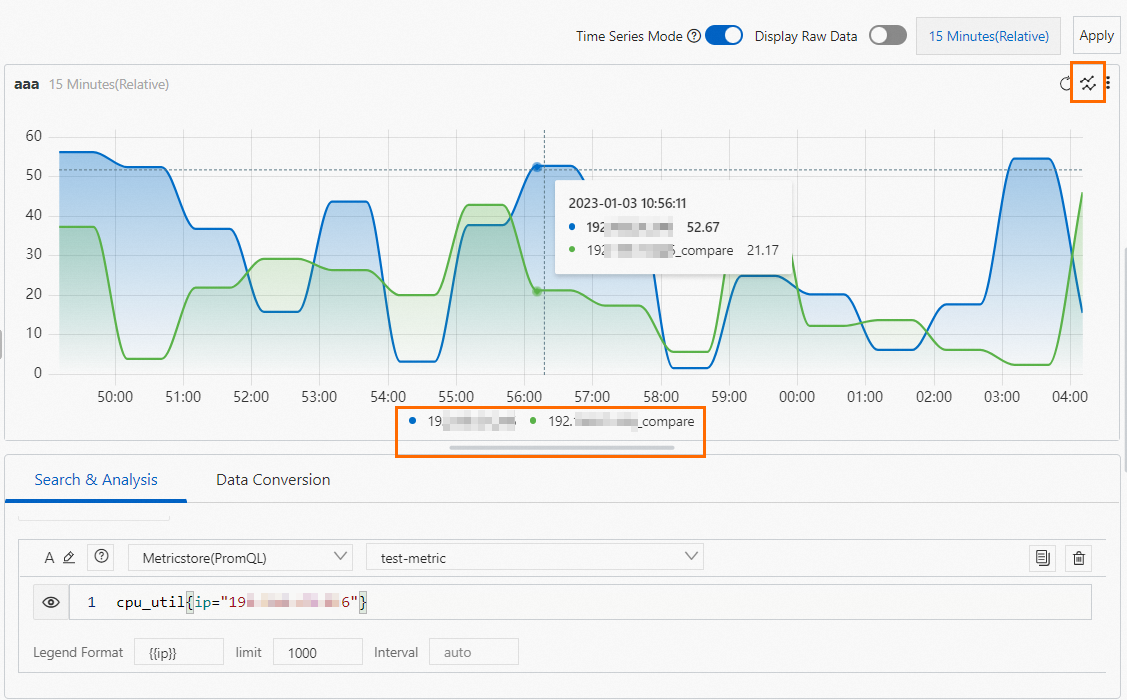
Comparison
You can use a time series chart to compare the values of a categorical variable of different time ranges. In this example, the CPU utilization of the 192.168.XX.XX host of the current time range is queried. If you want to compare the CPU utilization of the same time range on the previous day with the CPU utilization of the current time range, click the  icon and specify a time range. After you configure the settings, Simple Log Service automatically displays the comparison result.