When you collect logs in simple mode, the logs are not parsed. Each log is collected and then uploaded to Log Service as one log. This way, the process of log collection is simplified. This topic describes how to create a Logtail configuration in simple mode by using the Log Service console.
Prerequisites
A project and a Logstore are created. For more information, see Manage a project and Create a logstore.
The server on which Logtail is installed can connect to port 80 and port 443 of remote servers.
The server from which you want to collect logs continuously generates logs.
ImportantLogtail collects only incremental logs. If a log file on a server is not updated after the applied Logtail configuration is delivered to the server, Logtail does not collect logs from the file. For more information, see Read log files.
Background information
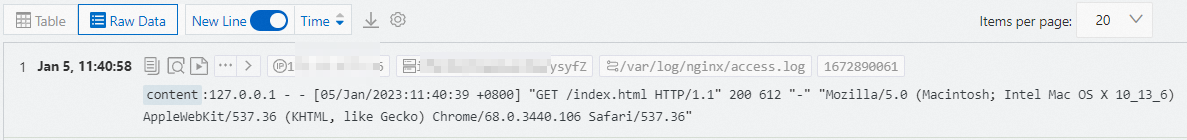
When you collect logs in simple mode, Logtail stores the content of the logs in the content field. Logtail does not extract fields from the logs. The timestamp of a log is the system time when the log is collected. The system time refers to the time of the server on which Logtail is installed. Example:
Raw log
127.0.0.1 - - [05/Jan/2023:11:40:39 +0800] "GET /index.html HTTP/1.1" 200 612 "-" "Mozilla/5.0 (Macintosh; Intel Mac OS X 10_13_6) AppleWebKit/537.36 (KHTML, like Gecko) Chrome/68.0.3440.106 Safari/537.36"Log collected to Log Service
In simple mode, you can collect the following types of text logs:
Single-line text log
Each log contains one line. Logs in a log file are separated with line feeds. If you collect single-line text logs, you need only to specify the directory and name of log files. This way, Logtail can collect the logs by line from the files that match the specified directory and name.
Multi-line text log
Each log contains multiple lines. If you collect multi-line text logs, you must specify the directory and name of log files. You must also enter a sample log and configure a regular expression to match the beginning of the first line of a log. If the regular expression matches log content, Logtail identifies a log and considers the content that does not match the regular expression as part of the log. Logtail identifies a new log upon the next match.
Procedure
By default, you can use only one Logtail configuration to collect logs from a log file. For more information about how to use multiple Logtail configurations to collect logs from a log file, see How do I collect multiple copies of logs in a file?
Log on to the Simple Log Service console.
In the Import Data section, click Multi-line - Text Log.
This example shows how to collect multi-line text logs. If you want to collect single-line text logs, click Single Line - Text Log.
Select the project and Logstore. Then, click Next.
Create a machine group.
If a machine group is available, click Use Existing Machine Groups.
If no machine groups are available, perform the following steps to create a machine group. In this example, an Elastic Compute Service (ECS) instance is used.
On the ECS Instances tab, select Manually Select Instances. Then, select the ECS instance that you want to use and click Create.
For more information, see Install Logtail on ECS instances.
ImportantIf you want to collect logs from an ECS instance that belongs to a different Alibaba Cloud account than Log Service, a server in a data center, or a server of a third-party cloud service provider, you must manually install Logtail. For more information, see Install Logtail on a Linux server or Install Logtail on a Windows server.
After you manually install Logtail, you must configure a user identifier for the server. For more information, see Configure a user identifier.
After Logtail is installed, click Complete Installation.
In the Create Machine Group step, configure the Name parameter and click Next.
Log Service allows you to create IP address-based machine groups and custom identifier-based machine groups. For more information, see Create an IP address-based machine group and Create a custom identifier-based machine group.
Select the new machine group from Source Server Groups and move the machine group to Applied Server Groups. Then, click Next.
ImportantIf you apply a machine group immediately after you create the machine group, the heartbeat status of the machine group may be FAIL. This issue occurs because the machine group is not connected to Simple Log Service. To resolve this issue, you can click Automatic Retry. If the issue persists, see What do I do if no heartbeat connections are detected on Logtail?
Create a Logtail configuration and click Next.
Parameter
Description
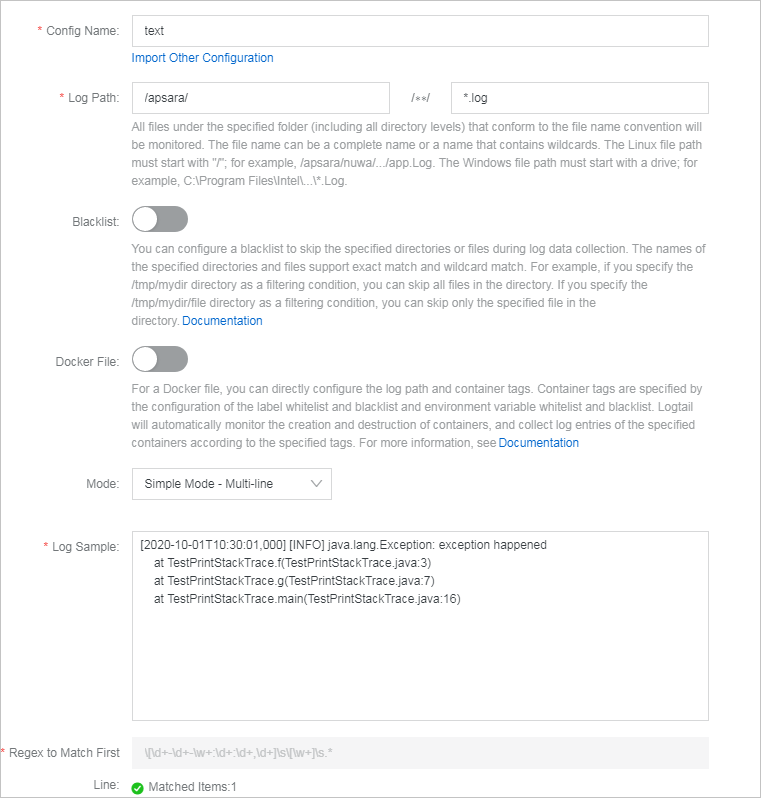
Config Name
Enter a name for the Logtail configuration. The name must be unique in a project. After you create the Logtail configuration, you cannot change the name of the Logtail configuration.
You can click Import Other Configuration to import an existing Logtail configuration.
Log Path
Specify the directory and name of log files based on the location of the logs on the server.
If you specify a log path in a Linux operating system, the path must start with a forward slash (/). Example: /apsara/nuwa/.../app.Log.
If you specify a log path in a Windows operating system, the path must start with a drive letter. Example: C:\Program Files\Intel\...\*.Log.
You can specify an exact directory and an exact name. You can also use wildcard characters to specify the directory and name. For more information, see Wildcard matching. Log Service scans all levels of the specified directory for the log files that match specified conditions. Examples:
If you specify /apsara/nuwa/**/*.log, Log Service collects logs from the log files whose names are suffixed by .log in the /apsara/nuwa directory and the recursive subdirectories of the directory.
If you specify /var/logs/app_*/*.log, Log Service collects logs from the log files that meet the following conditions: The file name is suffixed by .log. The file is stored in a subdirectory under the /var/logs directory or in a recursive subdirectory of the subdirectory. The name of the subdirectory matches the app_* pattern.
If you specify /var/log/nginx/**/access*, Log Service collects logs from the log files whose names start with access in the /var/log/nginx directory and the recursive subdirectories of the directory.
NoteWhen you configure this parameter, you can use only asterisks (*) or question marks (?) as wildcard characters.
You can use an asterisk (*) to match multiple characters.
You can use a question mark (?) to match a single character.
Blacklist
If you turn on Blacklist, you must configure a blacklist to specify the directories or files that you want Log Service to skip when it collects logs. You can specify exact directories and file names. You can also use wildcard characters to specify directories and file names. Examples:
If you select Filter by Directory from a drop-down list in the Filter Type column and enter /home/admin/dir1 for Content, all files in the /home/admin/dir1 directory are skipped.
If you select Filter by Directory from a drop-down list in the Filter Type column and enter /home/admin/dir* for Content, the files in all subdirectories whose names are prefixed by dir in the /home/admin/ directory are skipped.
If you select Filter by Directory from a drop-down list in the Filter Type column and enter /home/admin/*/dir for Content, all files in dir directories in each subdirectory of the /home/admin/ directory are skipped.
For example, the files in the /home/admin/a/dir directory are skipped, but the files in the /home/admin/a/b/dir directory are not skipped.
If you select Filter by File from a drop-down list in the Filter Type column and enter /home/admin/private*.log for Content, all files whose names are prefixed by private and suffixed by .log in the /home/admin/ directory are skipped.
If you select Filter by File from a drop-down list in the Filter Type column and enter /home/admin/private*/*_inner.log for Content, all files whose names are suffixed by _inner.log in the subdirectories whose names are prefixed by private in the /home/admin/ directory are skipped.
For example, the /home/admin/private/app_inner.log file is skipped, but the /home/admin/private/app.log file is not skipped.
NoteWhen you configure this parameter, you can use only asterisks (*) or question marks (?) as wildcard characters.
You can use an asterisk (*) to match multiple characters.
You can use a question mark (?) to match a single character.
If you use wildcard characters to configure Log Path and you want to skip some directories in the specified directory, you must configure the blacklist and enter a complete directory.
For example, if you set Log Path to /home/admin/app*/log/*.log and you want to skip all subdirectories in the /home/admin/app1* directory, you must select Filter by Directory and enter /home/admin/app1*/** to configure the blacklist. If you enter /home/admin/app1*, the blacklist does not take effect.
When a blacklist is in use, computational overhead is generated. We recommend that you add up to 10 entries to the blacklist.
You cannot specify a directory path that ends with a forward slash (/). For example, if you set the path to /home/admin/dir1/, the directory blacklist does not take effect.
Docker File
If you want to collect logs from Docker containers, you must turn on Docker File and specify the directories and tags of the containers. Logtail monitors containers to check whether containers are created or destroyed, filters containers by tag, and collects logs from the containers in the filtering result. For more information, see Use the Simple Log Service console to collect container text logs in DaemonSet mode.
Mode
Select the collection mode. Default value: Simple Mode - Multi-line. You can change the mode.
Log Sample
Enter a sample log that is collected from an actual scenario. Then, Log Service can automatically generate a regular expression to match the beginning of the first line of the log. Examples:
[2020-10-01T10:30:01,000] [INFO] java.lang.Exception: exception happened
    at TestPrintStackTrace.f(TestPrintStackTrace.java:3)
    at TestPrintStackTrace.g(TestPrintStackTrace.java:7)
    at TestPrintStackTrace.main(TestPrintStackTrace.java:16)
If you want to collect single-line text logs in simple mode, you do not need to configure this parameter.
Regex to Match First Line
Configure a regular expression to match the beginning of the first line of a log. Logtail uses the regular expression to match the beginning of the first line of a log and considers the content that does not match the regular expression as part of the log. Log Service can automatically generate a regular expression or use the regular expression that you manually specify.
Automatic generation
After you enter a sample multi-line text log, click Auto Generate. Log Service automatically generates a regular expression to match the beginning of the first line of the log.
Manual configuration
After you enter a sample multi-line text log, click Manual and manually specify a regular expression to match the beginning of the first line of the log. Then, click Validate to check whether the regular expression is valid. For more information, see How do I test a regular expression?
If you want to collect single-line text logs in simple mode, you do not need to configure this parameter.
Drop Failed to Parse Logs
Specify whether to drop the logs that fail to be parsed.
If you turn on Drop Failed to Parse Logs, the logs that fail to be parsed are not uploaded to Log Service.
If you turn off Drop Failed to Parse Logs, the logs that fail to be parsed are still uploaded to Log Service as the value of the __raw__ field.
Maximum Directory Monitoring Depth
Specify the maximum number of levels of subdirectories that you want to monitor. The subdirectories are in the log file directory that you specify. Valid values: 0 to 1000. A value of 0 specifies that only the log file directory that you specify is monitored.
You can configure advanced settings based on your business requirements. We recommend that you do not modify the advanced settings. The following table describes the parameters in the advanced settings.
Parameter
Description
Enable Plug-in Processing
If your logs are complex and cannot be parsed in modes such as the NGINX mode, full regex mode, or JSON mode, you can turn on Enable Plug-in Processing to add Logtail plug-ins to parse logs.
Log Service generates a default plug-in configuration based on the collection mode that you select. You can append other plug-in configurations to the default plug-in configuration by configuring the processors field. For more information, see Overview of Logtail plug-ins for data processing.
ImportantIf you turn on Enable Plug-in Processing, the parameters such as Upload Raw Log, Timezone, Drop Failed to Parse Logs, Filter Configuration, and Incomplete Entry Upload (Delimiter mode) become unavailable.
Upload Raw Log
If you turn on Upload Raw Log, each raw log is uploaded to Log Service as the value of the __raw__ field together with the log parsed from the raw log.
Topic Generation Mode
Select the topic generation mode. For more information, see Log topics.
Null - Do not generate topic: In this mode, the topic field is set to an empty string. When you query logs, you do not need to specify a topic. This is the default value.
Machine Group Topic Attributes: In this mode, topics are configured at the machine group level. If you want to distinguish the logs that are generated by different servers, select this mode.
File Path RegEx: In this mode, you must specify a regular expression in the Custom RegEx field. The part of a log path that matches the regular expression is used as the topic. If you want to distinguish the logs that are generated by different users or instances, select this mode.
Log File Encoding
The encoding format of log files. Valid values: utf8 and gbk.
Timezone
Select the time zone in which logs are collected. Valid values:
System Timezone: If you select this value, the time zone of the server or the container on which Logtail is installed is used.
Custom: If you select this value, you must select a time zone based on your business requirements.
Timeout
If a log file is not updated within the specified period, Logtail considers the monitoring to be timed out.
Never: All log files are continuously monitored, and the monitoring never times out.
30 Minute Timeout: If a log file is not updated within 30 minutes, Logtail considers the monitoring to be timed out and no longer monitors the file.
If you select 30 Minute Timeout, you must configure the Maximum Timeout Directory Depth parameter. Valid values: 1 to 3.
Filter Configuration
Specify the filter conditions that you want to use to collect logs. A filter condition consists of Key and Regex. Key specifies the name of the required field, and Regex specifies the regular expression that is used for filtering. The logical operator between filter conditions is AND.
ImportantIn simple mode, only the content field is generated. If you want to specify filter conditions, you can set Key only to content.
The regular expression that you specify supports only full-text matching. Keyword matching is not supported.
Examples:
Collect the logs that match the specified filter conditions.
If you set Key to level and set Regex to WARNING|ERROR, only the logs in which the value of level is WARNING or ERROR are collected.
If you set Key to content and set Regex to .*05\/Jan\/2023.*, only the logs in which the value of content contains 05/Jan/2023 are collected.
Filter out the logs that do not match the specified filter conditions.
If you set Key to level and set Regex to ^(?!.*(INFO|DEBUG)).*, logs in which the value of level contains INFO or DEBUG are filtered out.
If you set Key to level and set Regex to ^(?!(INFO|DEBUG)$).*, logs in which the value of level is INFO or DEBUG are filtered out.
If you set Key to url and set Regex to .*^(?!.*(healthcheck)).*, logs in which the value of url contains healthcheck are filtered out.
For more information about how to specify a regular expression, see Getting started with regular expressions.
First Collection Size
Specify the size of data that Logtail can collect from a log file the first time Logtail collects logs from the file. The default value of First Collection Size is 1024. Unit: KB.
If the file size is less than 1,024 KB, Logtail collects data from the beginning of the file.
If the file size is greater than 1,024 KB, Logtail collects the last 1,024 KB of data in the file.
You can specify First Collection Size based on your business requirements. Valid values: 0 to 10485760. Unit: KB.
More Configurations
Specify extended settings for Logtail. For more information, see advanced.
For example, if you want to use the current Logtail configuration to collect logs from log files that match a different Logtail configuration and specify the interval at which logs are aggregated and sent to Log Service, you can specify extended settings for the current Logtail.
{
  "force_multiconfig": true,
  "batch_send_interval": 3
}
Click Next to complete the Logtail configuration creation. Then, Log Service starts to collect logs.
NoteA Logtail configuration requires up to 3 minutes to take effect.
If an error occurs when you use Logtail to collect logs, see How do I view Logtail collection errors? and How do I troubleshoot the common errors that may occur when Simple Log Service collects logs?
Preview data, configure indexes, and then click Next.
By default, full-text indexing is enabled for Log Service. You can also configure field indexes based on collected logs in manual mode or automatic mode. To configure field indexes in automatic mode, click Automatic Index Generation. This way, Log Service automatically creates field indexes. For more information, see Create indexes.
ImportantIf you want to query and analyze logs, you must enable full-text indexing or field indexing. If you enable both full-text indexing and field indexing, the system uses only field indexes.
Click Query Log. You are redirected to the query and analysis page of your Logstore.
You must wait approximately 1 minute for the indexes to take effect. Then, you can view the collected logs on the Raw Logs tab. For more information, see Guide to log query and analysis.
Troubleshooting
If no data is displayed on the preview page or query page after logs are collected by using Logtail, you can troubleshoot the errors based on the instructions that are provided in What do I do if errors occur when I use Logtail to collect logs?