This topic describes how to analyze Log4j logs. In this example, the logs of an e-commerce company are analyzed.
Prerequisites
Log4j logs are collected. For more information, see Collect Log4j logs.
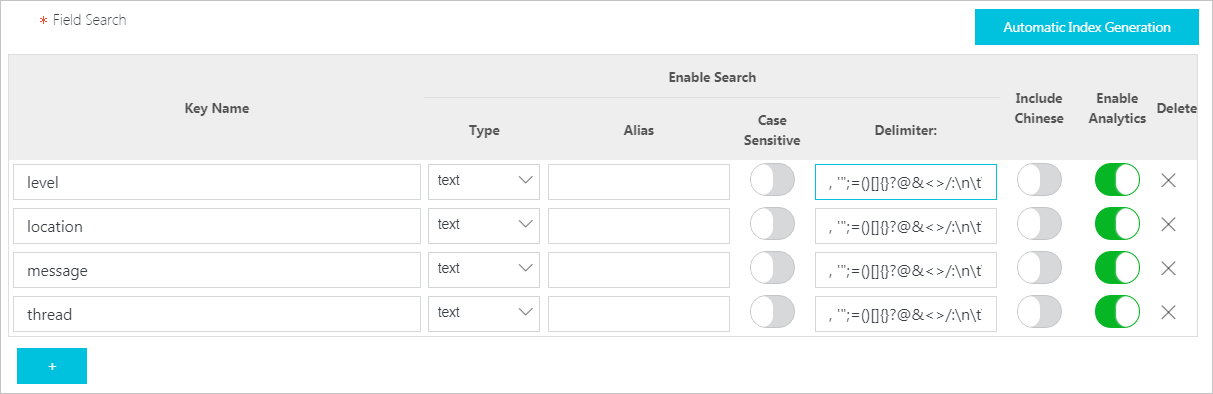
Indexes are created. For more information, see Create indexes.
The following figure shows the indexes that are used in this example.
Background information
Apache Log4j is an open source project that allows you to configure the log output destination to console, file, GUI component, socket server, NT event recorder, or UNIX Syslog daemon. Apache Log4j also allows you to set the output format for each log and define the level of each log to manage log generation in a more detailed manner. To configure the preceding features, you need to only use a configuration file. You do not need to modify the application code. Log4j consists of the following main components:
Layouts
Layouts are used to format logs into a specific format. The following table describes common layouts.
Layout
Description
HTMLLayout
Formats logs as HTML tables.
SimpleLayout
Formats logs into a simple format, such as INFO-level logs.
PatternLayout
Outputs logs in a custom format. You can specify the arrangements and formats of elements, such as timestamp, log level, thread name, class name, method name, and log data.
Appenders
Appenders are used to define the destinations of logs. You can configure multiple appenders to send logs to different destinations. The following table describes common appenders.
Appender
Description
ConsoleAppender
Outputs logs to a console.
FileAppender
Outputs logs to a file.
DailyRollingFileAppender
Outputs logs to a new file every day.
RollingFileAppender
Outputs logs to a file with a specific size. When the file reaches the specified size, the system automatically changes the name of the file and generates a new file.
JDBCAppender
Stores logs to a database.
Loggers
Loggers are used to define the entry points of logs and capture log information. Each Logger is assigned a log level based on its importance or severity. Log4j defines the following log levels: OFF, FATAL, ERROR, WARN, INFO, DEBUG, TRACE, and ALL (listed in descending order of priority). Log levels can be inherited. Child classes record all log levels of the parent class. The following table describes the log levels.
Log level
Description
OFF
Disables all logs.
FATAL
Indicates error events that can cause applications to exit.
ERROR
Indicates error events that do not affect the running of systems.
WARN
Indicates potential errors.
INFO
Focuses on the running of applications. In most cases, this log level is used in scenarios in which logs are managed in a coarse-grained manner.
DEBUG
Facilitates diagnostic. In most cases, this log level is used in application debugging scenarios.
TRACE
Outputs the variables during the running of programs and displays the execution process. This log level is used to trace programs.
ALL
Prints all logs.
A logger can correspond to multiple appenders. An appender can correspond to only one layout.
In this example, the company wants to obtain the best solution for its e-commerce platform. The company needs to analyze information such as platform stability, system errors, data security, and behavioral data. The behavioral data includes logon methods, logon time, logon duration, browsed pages, dwell time for pages, average order time, and consumption levels. Simple Log Service provides the log collection and log analysis features to help store and analyze logs. The following examples show sample logs that are collected by Simple Log Service.
The following log records logon information:
level:  INFO
location:  com.aliyun.log4jappendertest.Log4jAppenderBizDemo.login(Log4jAppenderBizDemo.java:38)
message:  User login successfully. requestID=id4 userID=user8
thread:  main
time:  2022-01-26T15:31+0000
The following log records purchase information:
level:  INFO
location:  com.aliyun.log4jappendertest.Log4jAppenderBizDemo.order(Log4jAppenderBizDemo.java:46)
message:  Place an order successfully. requestID=id44 userID=user8 itemID=item3 amount=9
thread:  main
time:  2022-01-26T15:31+0000
Procedure
Log on to the Simple Log Service console.
In the Projects section, click the project that you want to manage.

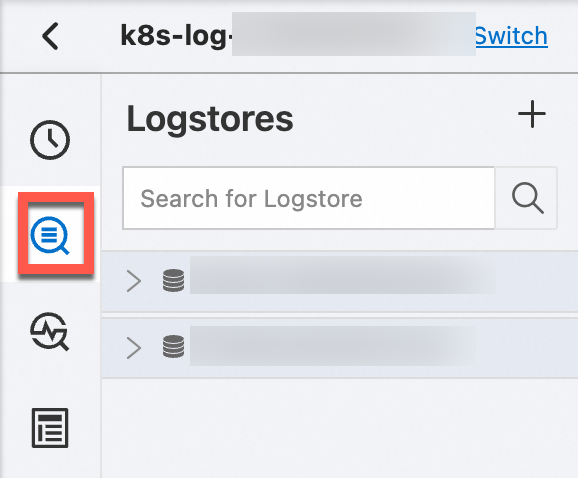
In the left-side navigation pane, click Log Storage. In the Logstores list, click the Logstore that you want to manage.
Enter a query statement in the search box, and click Last 15 Minutes to specify a query time range.
For more information, see Step 1: Enter a query statement.
Query the three positions at which the most errors occur within the previous hour.
level: ERROR | select location ,count(*) as count GROUP BY location ORDER BY count DESC LIMIT 3Query the numbers of logs at each log level that are generated within the previous 15 minutes.
* | select level ,count(*) as count GROUP BY level ORDER BY count DESCQuery the three users that log on to the platform most frequently within the previous hour.
login | SELECT regexp_extract(message, 'userID=(?<userID>[a-zA-Z\d]+)', 1) AS userID, count(*) as count GROUP BY userID ORDER BY count DESC LIMIT 3Query the total payment of each user within the previous 15 minutes.
order | SELECT regexp_extract(message, 'userID=(?<userID>[a-zA-Z\d]+)', 1) AS userID, sum(cast(regexp_extract(message, 'amount=(?<amount>[a-zA-Z\d]+)', 1) AS double)) AS amount GROUP BY userID