After using Log4j2 to manage runtime logs for your Java applications, you can use a Log4j2 appender or Logtail to send them to Simple Log Service for analysis.
Log4j overview
Log4j is an open-source project from Apache. With Log4j, you can configure log destinations, such as consoles, files, GUI components, Socket servers, NT Event Loggers, and UNIX Syslog daemons. You can also control the output format of each log message. By defining the level for each log message, you can control the log generation process in greater detail. These settings can be flexibly configured in a configuration file without requiring changes to the application code. Log4j consists of three important components, as follows:
-
Layouts
Layouts format log messages. The following table describes common layouts.
Layout
Description
HTMLLayout
Formats log output as an HTML table.
SimpleLayout
Applies a simple output format, such as the default format for INFO-level messages.
PatternLayout
Outputs logs in a custom format. You can specify the arrangement and format of elements such as the timestamp, log level, thread name, class name, method name, and log message.
-
Appenders
Appenders send log messages to a destination. You can configure multiple appenders to send logs to various destinations. The following table describes common appenders.
Appender
Description
ConsoleAppender
Writes logs to the console.
FileAppender
Writes logs to a file.
DailyRollingFileAppender
Writes logs to a file and rolls over to a new file daily.
RollingFileAppender
When the file reaches a specified size, Log4j renames it and creates a new one.
JDBCAppender
Saves log messages to a database.
-
Loggers
Loggers capture log information. Each logger is assigned a log level based on its importance or severity. Log4j defines eight log levels, listed here from highest to lowest priority: OFF, FATAL, ERROR, WARN, INFO, DEBUG, TRACE, and ALL. Log levels are inherited, which means a child logger inherits all log levels of its parent. The following table describes each log level.
Log level
Description
OFF
Turns off all logging.
FATAL
Indicates a severe error that will cause the application to exit.
ERROR
Indicates an error that does not stop the application.
WARN
Warns of a potential error.
INFO
Tracks application progress at a high level.
DEBUG
Provides detailed information for debugging.
TRACE
Provides detailed information to trace program execution, such as variable values and execution flow.
ALL
Enables all log levels.
A logger can be associated with multiple appenders, but an appender can be associated with only one layout.
Prerequisites
-
Create a project and a logstore. For more information, see Manage projects and Manage logstores.
-
If you use a RAM user instead of an Alibaba Cloud account, you must grant the RAM user the permissions to write to a logstore. To grant the permissions, first create a custom policy and then grant permissions to the RAM user.
Procedure
This topic uses the Java language and Log4j2 as an example. You can use the Log4j interfaces for other languages, such as C, C++, .NET, and PL/SQL. The syntax and usage are similar to those in Java.
Step 1: Configure Log4j2
-
Add the required dependencies to your Maven project.
<dependencies> <dependency> <groupId>org.apache.logging.log4j</groupId> <artifactId>log4j-api</artifactId> <version>2.23.1</version> </dependency> <dependency> <groupId>org.apache.logging.log4j</groupId> <artifactId>log4j-core</artifactId> <version>2.23.1</version> </dependency> </dependencies> -
Modify the configuration file.
By default, Log4j2 looks for a configuration file in the classpath. If one does not exist, you must create it manually. The following example shows a
log4j2.xmlfile that defines two appenders to output logs to the console and a file namedapp.log. The root logger is set to theerrorlog level and outputs to the console. A logger namedcom.example.demo.logis set to thetracelog level and outputs to the file. For more information about how to configure Log4j2, see the official Log4j 2 Configuration documentation.<!-- status="WARN" sets the internal status of Log4j 2 itself, not the application logging. It is used to capture and report potential issues during the configuration process. --> <Configuration status="WARN"> <!-- Define two log output destinations (Appenders) start --> <Appenders> <!-- Defines a console appender named "Console" that prints logs to the standard system output. --> <Console name="Console" target="SYSTEM_OUT"> <PatternLayout pattern="%d{yyyy-MM-dd HH:mm:ss:SSS zzz} [%t] %-5level %logger{36} - %msg%n"/> </Console> <!-- Defines a file appender named "MyFile" that writes logs to the "app.log" file. --> <File name="MyFile" fileName="app.log"> <PatternLayout pattern="%d{yyyy-MM-dd HH:mm:ss:SSS zzz} [%t] %-5level %logger{36} - %msg%n"/> </File> </Appenders> <!-- Define two log output destinations (Appenders) end --> <!-- Configure logging behavior (Loggers) start --> <Loggers> <!-- Defines a logger named "com.example.demo.log" with its level set to "trace". It references the "MyFile" appender, which means this logger outputs logs at the "trace" level and above to its appender ("MyFile"). --> <Logger name="com.example.demo.log" level="trace"> <AppenderRef ref="MyFile" /> </Logger> <!-- Defines the root logger with its level set to "error". It references the "Console" appender, which means logs at the "error" level and above are output to the console. --> <Root level="error"> <AppenderRef ref="Console" /> </Root> </Loggers> <!-- Configure logging behavior (Loggers) end --> </Configuration> -
Basic usage.
Write the sample code to read the defined appender and output logs:
public void logExampleDemo() { // Get a Logger instance named "com.example.demo.log". Logger logger = LogManager.getLogger("com.example.demo.log"); // Record log messages at different levels. logger.trace("trace level"); logger.debug("debug level"); logger.info("info level"); logger.warn("warn level"); logger.error("error level"); logger.fatal("fatal level"); } -
The following sample shows the log output.
2024-05-28 13:37:16:295 CST [http-nio-8080-exec-8] TRACE com.example.demo.log - trace level
2024-05-28 13:37:16:296 CST [http-nio-8080-exec-8] DEBUG com.example.demo.log - debug level
2024-05-28 13:37:16:296 CST [http-nio-8080-exec-8] INFO  com.example.demo.log - info level
2024-05-28 13:37:16:296 CST [http-nio-8080-exec-8] WARN  com.example.demo.log - warn level
2024-05-28 13:37:16:296 CST [http-nio-8080-exec-8] ERROR com.example.demo.log - error level
2024-05-28 13:37:16:296 CST [http-nio-8080-exec-8] FATAL com.example.demo.log - fatal level
Step 2: Collect Log4j logs
-
If your application already uses Log4j2, you can configure the appender to send logs in real time without writing them to disk.
-
Logtail is an agent that you install on your server to collect logs from files. It also supports various processing plug-ins.
Log4j2 appender

-
Add the required dependencies to your Maven project.
<dependency> <groupId>com.google.protobuf</groupId> <artifactId>protobuf-java</artifactId> <version>2.5.0</version> </dependency> <dependency> <groupId>com.aliyun.openservices</groupId> <artifactId>aliyun-log-log4j2-appender</artifactId> <version>0.1.12</version> </dependency> -
Modify the configuration file.
The following example uses an XML configuration file named
log4j2.xml. If the file does not exist, create it in the root directory of your project. Configure the Loghub appender and logger:<Appenders> <Loghub name="Loghub" project="your project" logStore="your logStore" endpoint="your project endpoint" accessKeyId="your accessKey id" accessKeySecret="your accessKey secret" totalSizeInBytes="104857600" maxBlockMs="0" ioThreadCount="8" batchSizeThresholdInBytes="524288" batchCountThreshold="4096" lingerMs="2000" retries="10" baseRetryBackoffMs="100" maxRetryBackoffMs="100" topic="your topic" source="your source" timeFormat="yyyy-MM-dd'T'HH:mmZ" timeZone="UTC" ignoreExceptions="true"> <PatternLayout pattern="%d %-5level [%thread] %logger{0}: %msg"/> </Loghub> </Appenders> <Loggers> <Root level="warn"> <AppenderRef ref="Loghub"/> </Root> </Loggers>The
project,logStore,endpoint,accessKeyId, andaccessKeySecretparameters are required. Optional parameters use default values if not specified. The following table describes the parameters.Parameter
Description
project
The name of your Simple Log Service project.
logStore
The name of your logstore in Simple Log Service.
endpoint
The public endpoint of Simple Log Service. For more information, see Endpoints.
accessKeyId
Your AccessKey ID. To obtain one, see Create an AccessKey pair.
accessKeySecret
Your AccessKey Secret. To obtain one, see Create an AccessKey pair.
-
Sample code.
import org.apache.logging.log4j.LogManager;
import org.apache.logging.log4j.Logger;

public class Log4j2AppenderExample {

    private static final Logger LOGGER = LogManager.getLogger(Log4j2AppenderExample.class);

    public static void main(String[] args) throws InterruptedException {
        LOGGER.trace("log4j2 trace log");
        LOGGER.debug("log4j2 debug log");
        LOGGER.info("log4j2 info log");
        LOGGER.warn("log4j2 warn log");
        LOGGER.error("log4j2 error log", new RuntimeException("Runtime Exception"));
        Thread.sleep(1000 * 5);
    }
}
Logtail

When you configure Logtail, you must provide a file path. Make sure that your application can write logs to the log file.
If your Elastic Compute Service (ECS) instance and Simple Log Service project are in the same account and region, see Collect text logs from servers. For all other scenarios, see Manually install Logtail to collect text logs from servers.
Step 3: View logs
Log on to the Simple Log Service console.
In the Projects section, click the one you want.

On the tab, click the logstore you want.

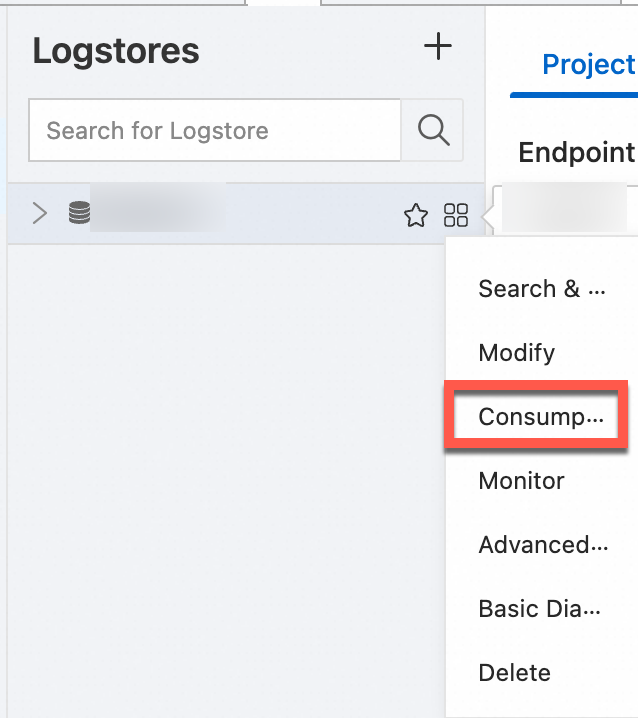
-
Verify that log data is successfully uploaded. In the logstore, see Quick start for search and analysis, and then click Consumption Preview to quickly view the logs.
-
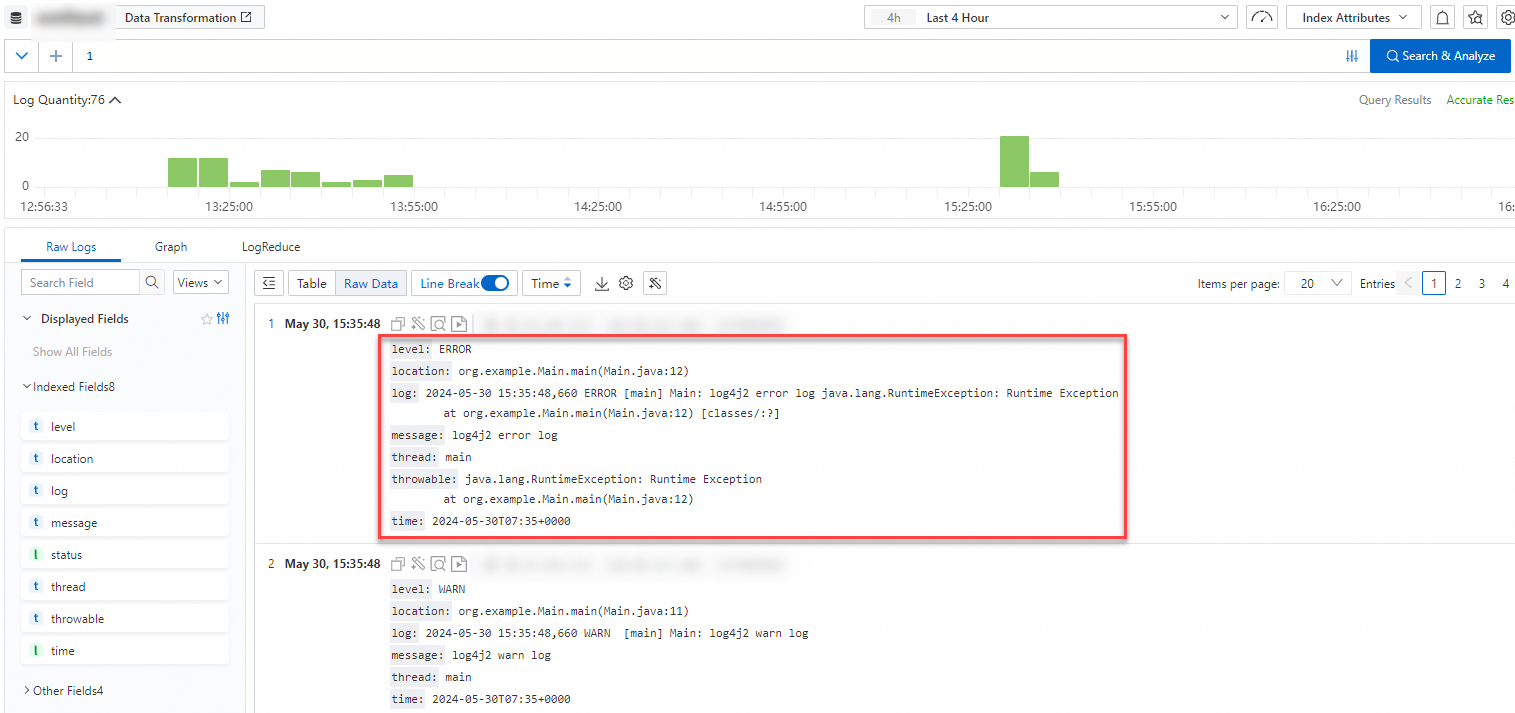
Query and analyze logs.
ImportantBefore you can query and analyze logs, you must create indexes for the logstore. For more information about how to create indexes, see Create indexes.
Enter a query statement and select a time range, such as Last 15 Minutes. The following sample shows a log entry.
level: ERROR
location: com.aliyun.openservices.log.log4j.example.Log4jAppenderExample.main(Log4jAppenderExample.java:16)
message: error log
throwable: java.lang.RuntimeException: xxx
thread: main
time: 2018-01-02T03:15+0000
log: 0 [main] ERROR com.aliyun.openservices.log.log4j.example.Log4jAppenderExample - error log
__source__: xxx
__topic__: yyy
Query and analyze logs on the logstore page.
You can enter query statements to view, search, and filter log data. For more information, see Query and analyze logs. The following examples show simple query statements:
-
Find the top three locations with the most errors in the last hour.
level: ERROR | select location ,count(*) as count GROUP BY location ORDER BY count DESC LIMIT 3 -
Count the logs for each log level in the last 15 minutes.
| select level ,count(*) as count GROUP BY level ORDER BY count DESC
-
Related topics
-
To learn how to use Logtail to collect logs from a server, see Collect text logs from servers. You can choose from various plug-ins. For more information, see Use plug-ins to process data.
-
If you see no data after configuring Logtail, refer to Troubleshoot Logtail log collection errors to troubleshoot. Common issues include regex failures, incorrect file paths, or exceeding shard capacity. You can view specific collection errors by following the steps in View Logtail collection errors or consult the list of Common errors of data collection.
-
For use cases and frequently asked questions (FAQs) about using the Log4j2 appender to collect Log4j logs, see Log4j2 Appender. For earlier versions, see Log4j Appender.
-
The Log4j2 appender requires an AccessKey ID, an AccessKey Secret, and an endpoint. For instructions on obtaining these, see Create an AccessKey pair and Endpoints.