After you collect NGINX access logs in Simple Log Service (SLS), you can use query and analytic statements to count the number of logs for different status codes and request methods. This topic uses NGINX access logs as an example to describe how to add a filter.
Prerequisites
NGINX access logs are collected. For more information, see Collect text logs from servers.
Indexes are created. For more information, see Create indexes.
Use case 1: Filter logs with a status code of 200
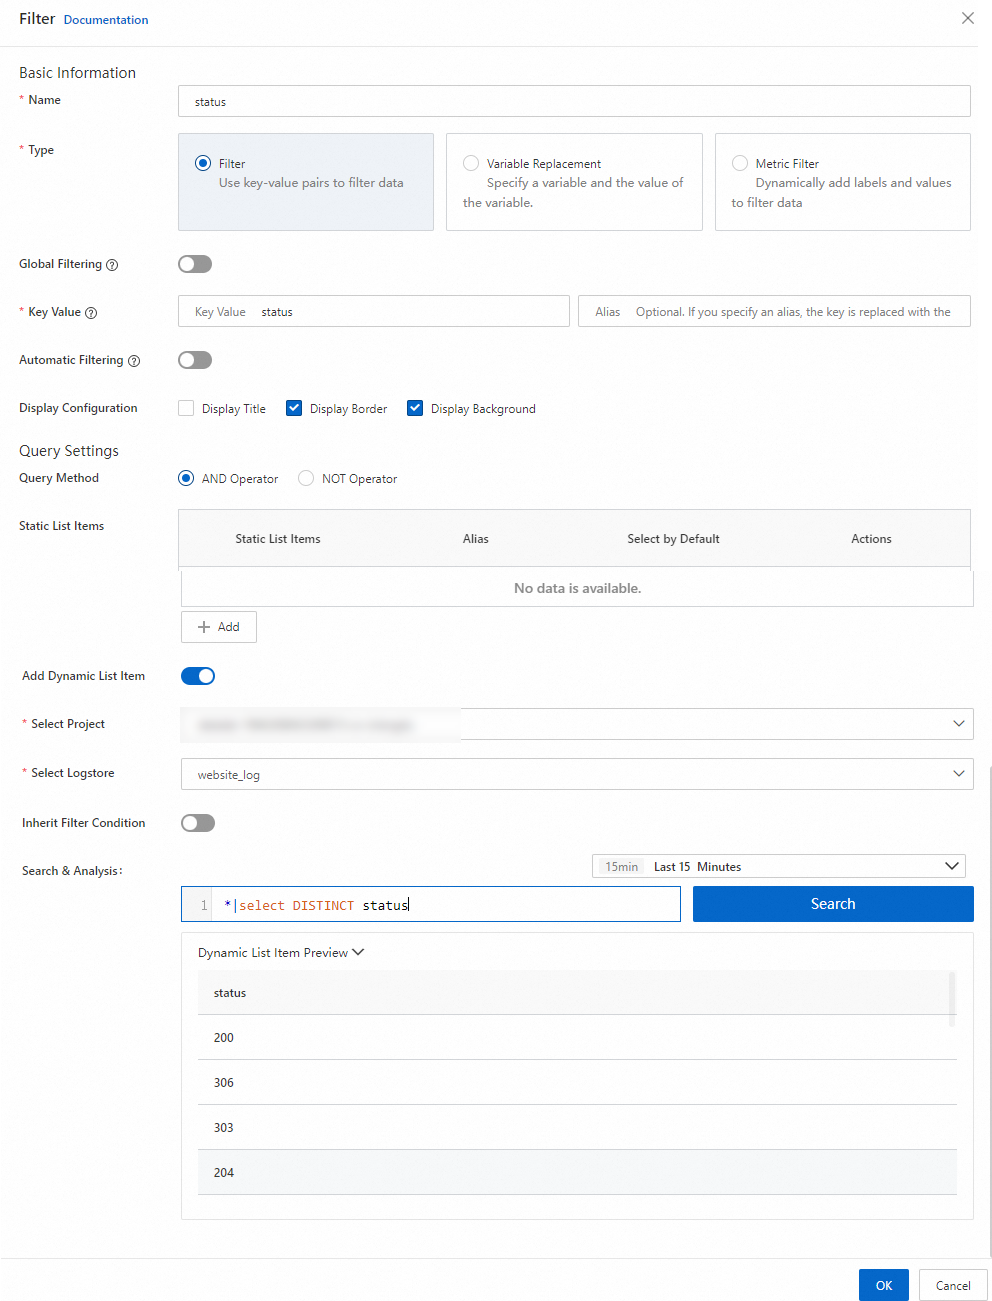
To filter for logs with a status code of 200, the query is transformed into the analytic statement status: 200 AND [search query] | [sql query] based on the filter configuration. In this case, the key is status and the value is 200. The following steps describe the configuration.
In the edit mode of the dashboard, click the Filter
 icon in the upper-right corner.
In the Filter panel, configure the following settings and click OK.
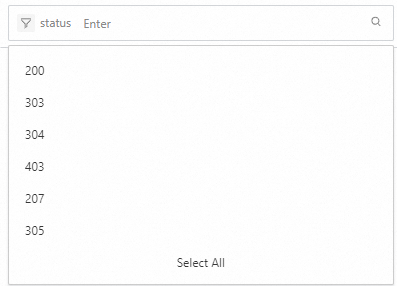
The configured filter is shown in the following figure.
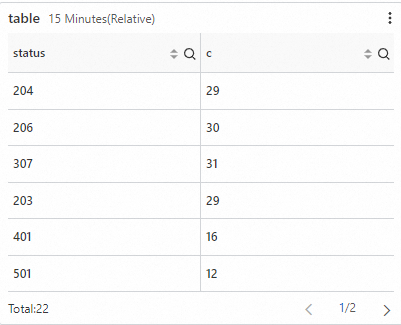
The following is the raw data.
Analytic statement:
* | select status, count(*) as c group by statusThe following table lists the count for each status:
In the filter settings, set
statusto200to filter out data with any other status.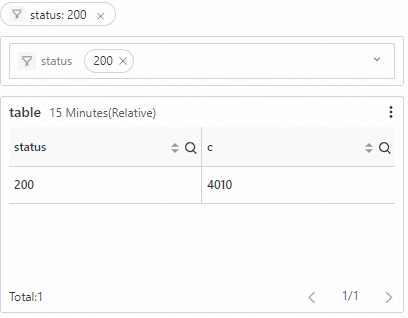
The analytic statement for the chart is:
(*)and (status: 200)| select status, count(*) as c group by status
Use case 2: Filter out logs that are not accessed using the GET or POST method from NGINX access logs
To exclude logs that use the GET or POST method, the query is transformed into the analytic statement NOT (request_method: GET OR request_method: POST) AND [search query] | [sql query] based on the filter configuration. The key is request_method, and the values are GET and POST. The following steps describe the configuration.
In the edit mode of the dashboard, click the Filter
icon in the upper-right corner.In the Filter panel, configure the following settings and click OK.
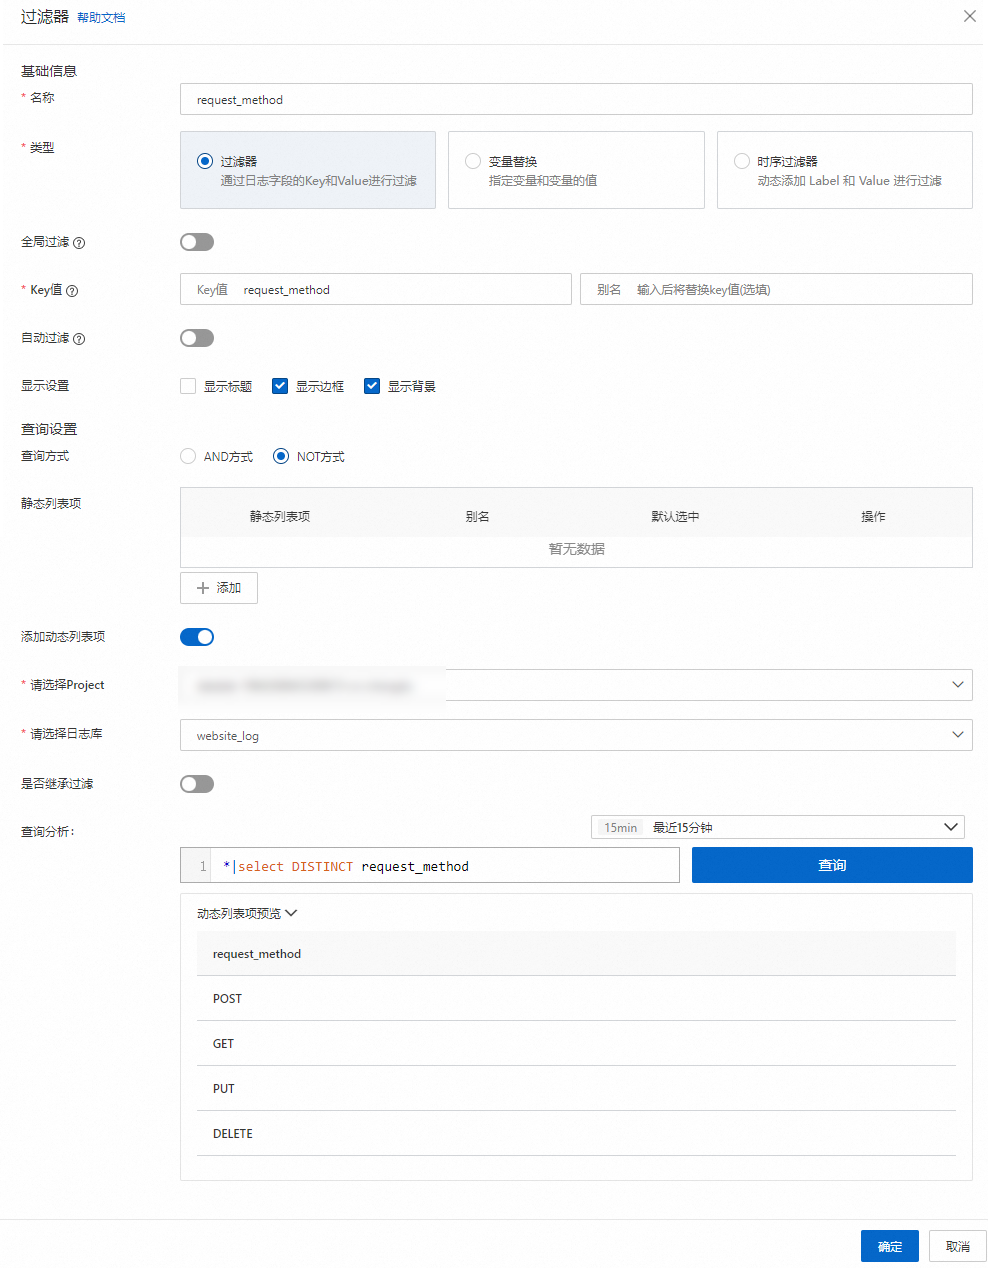
The configured filter is shown in the following figure.
The following is the original query data.
Analytic statement:
* | select request_method, count(*) as c group by request_methodThe following table shows the count of different
request_methodvalues.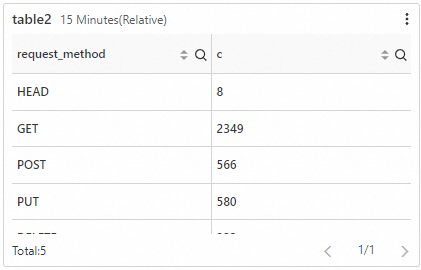
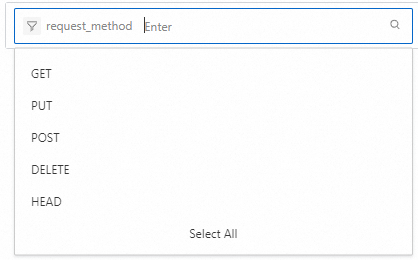
In the filter settings, select
POSTandGETforrequest_method. This displays only logs with a request method of POST or GET.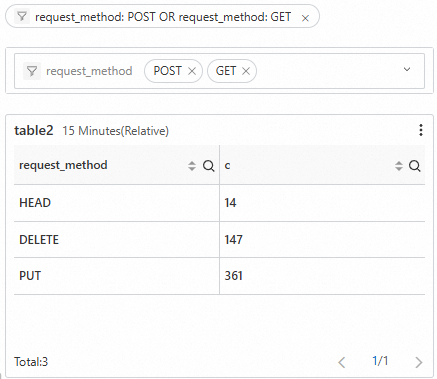
The analytic statement for the chart is:
(*)not (request_method: POST OR request_method: GET) | select request_method, count(*) as c group by request_method