Filter dashboards and charts
Variables let you filter individual charts or entire dashboards without modifying the underlying query statements. They use the syntax ${{variable_name|default_value}} or ${{variable_name|default_value|prefix}} to dynamically adjust placeholders in your query statements. You can filter data across an entire dashboard or within a single chart.
Filter an entire dashboard
Filter types
Each chart is powered by a query statement. Filters modify query conditions or replace placeholder variables for all charts on a dashboard. Simple Log Service (SLS) supports three types of filters:
-
Filter: Uses key-value pairs from log fields to filter data. It searches query results for logs that contain or do not contain a specific
Key:Valuepair. For example, when you view page views (PVs) for different request methods, you can add a filter to switch between methods using dynamic list items. -
Variable Replacement: You first define a variable in your chart's query statement and then add a filter to dynamically replace it with a selected value. For example, view PVs per 10, 60, or 600 seconds.
-
Metric Filter: Refines ingested metrics based on their labels and corresponding values. If you specify multiple filter conditions, they are combined with a logical AND.
Filter type
Step 1: Add a chart to a dashboard
-
On the dashboard, enter edit mode and click .
-
On the left, configure the query time range, Logstore, and query statement. On the right, select a chart type, such as a table. Click Apply to preview the chart, and then click OK to save it.
The following query statement retrieves the number of PVs per minute:
* | SELECT date_format(__time__ - __time__ % 60, '%H:%i:%s') as time, count(1) as count GROUP BY time ORDER BY time
Step 2: Add a filter of the filter type
-
On the dashboard, enter edit mode and click the
 icon in the upper-right corner.
 -
In the Filter panel, configure the settings and click OK.
The following is a sample query statement used for the dynamic list item preview:
*|select distinct request_methodIn this example, set Key to
request_method, select website_log as the Logstore, and set the time range to 15min (Last 15 minutes). The dynamic list item preview shows GET, POST, DELETE, and PUT. -
Adjust the page layout, click Save, and in the Save Dashboard dialog box, click Confirm.
Step 3: Verify the results
On the dashboard, select GET and PUT from the request_method drop-down list to query the PVs for the GET and PUT methods. This action runs the following query statement:
(*)and (request_method: GET OR request_method: PUT)| SELECT date_format(__time__ - __time__ % 60, '%H:%i:%s') as time, count(1) as count GROUP BY time ORDER BY time Variable replacement type
Step 1: Define a variable in a chart query
-
On the dashboard, enter edit mode and click .
-
On the left, configure the query time range, Logstore, and a query statement that includes a variable. On the right, select a chart type. Click Apply to preview the chart, and then click OK to save it.
The following query statement retrieves the number of PVs over different time intervals. The
${{interval|60}}syntax defines a variable namedintervalwith a default value of 60.* | SELECT date_format(__time__ - __time__ % ${{interval|60}}, '%H:%i:%s') as time, count(1) as count GROUP BY time ORDER BY time
Step 2: Add a variable replacement filter
-
On the dashboard, enter edit mode and click the
icon in the upper-right corner. -
In the Filter panel, configure the settings and click OK.
Note-
The Key Value must match the variable name you defined in the query statement. In this example, the value is interval.
-
Use Static List Items to configure the values for the variable.
In this example, set Name to
PV Filter. For Static list item, add the variable values10,60, and600, which represent seconds. Then, click OK. -
-
Adjust the page layout, click Save, and in the Save Dashboard dialog box, click Confirm.
Step 3: Verify the results
-
On the dashboard, in the PV Filter, set interval to 10 to query the PVs per 10 seconds.
This action runs the following query statement:
* | SELECT date_format(__time__ - __time__ % 10, '%H:%i:%s') as time, count(1) as count GROUP BY time ORDER BY time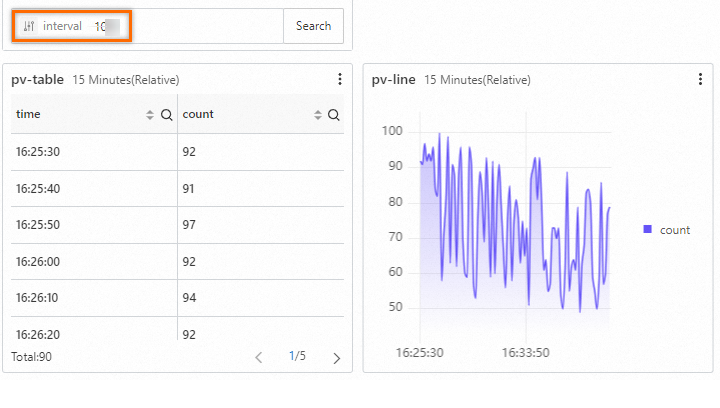
-
On the dashboard, in the PV Filter, set interval to 60 to query the PVs per 60 seconds.
This action runs the following query statement:
* | SELECT date_format(__time__ - __time__ % 60, '%H:%i:%s') as time, count(1) as count GROUP BY time ORDER BY time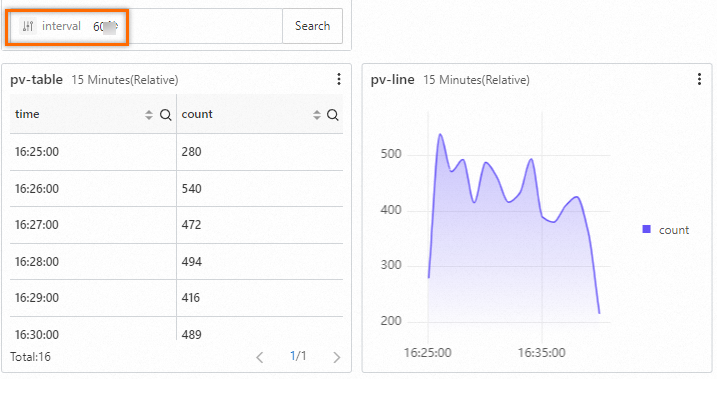
Metric filter
-
Ingest metrics. For example, collect host monitoring data.
-
Add a filter. After you ingest host data, SLS automatically creates a dashboard named Host Monitoring. On the Host Monitoring dashboard, enter edit mode and click the
icon in the upper-right corner. In the Filter panel, configure the settings and click OK.For Key, select Host.
-
Filter the dashboard. At the top of the dashboard page, select a label and a value from the drop-down list.


Filter a single chart with variable replacement
You can configure Variable Replacement for a single chart. SLS adds a filter to the upper-left corner of that chart, which lets you refine its data independently. The following example configures a table to view PVs over different time intervals.
Step 1: Configure variable replacement
-
On the left side of the chart editing page, configure the query time range, Logstore, and a query statement that includes a variable.
The following query statement retrieves the PVs for different time intervals. The
${{date|60}}syntax defines a variable nameddatewith a default value of 60.* | select __time__ - __time__ % ${{date | 60}} as time, COUNT(*) as pv, avg(request_time) as duration, request_method GROUP BY time, request_method order by time limit 1000After you run the query, set the Logstore to website_log and the time range to 15 Minutes(Relative). The query result displays the PV and average request time grouped by time and request method in a table.
-
Configure the variable replacement.
-
On the right side of the chart editing page, select Table as the chart type, and click .
-
In the Variable Replacement dialog box, set Variable Key to date and Display Name to time. For the variable values, set the Display Name to min and hour, with corresponding replacement values of 60 and 3600.
-
-
In the upper-right corner of the page, click OK. Then, click Save. In the Save Dashboard dialog box, click Confirm.
Step 2: Filter the chart
After you save the settings, a filter appears in the upper-left corner of the chart. When you select a value from the filter, SLS reruns the query with the new value. For example, if you select hour, SLS executes the following query statement:
(*)| select __time__ - __time__ % 3600 as time, COUNT(*) as pv, avg(request_time) as duration, request_method GROUP BY time, request_method order by time limit 1000 Use variables with interaction events
When you configure an Interaction Occurrences for a chart, you can also define a variable. When you trigger the interaction, the system automatically updates the variable with the value from the interaction. This dynamically links charts for drill-down analysis. For a detailed example, see Configuration examples.
In the Open Logstore configuration window, select the target Logstore, such as website_log. In the Filter query input box, click Add Variable to reference a variable. For example, in the query * | SELECT date_format(__time__ - __time__ % 60, '%H:%i:%s') as "${time}", ${time} is the variable defined in the interaction occurrence.
Advanced usage: Use variables with a prefix
You can enhance filtering by including a prefix in your variables, using the syntax ${{variable_name|default_value|prefix}}.
-
If no value is selected for the variable, the query runs using the default value.
-
If a value is selected, the query combines the prefix and the selected value.
Filter a dashboard: HTTP method filtering
Variable
-
Variable format:
${{method_filter|http_method in ('GET','POST')|http_method =}} -
Query statement:
(*)|select status, count(1) as err_count where ${{method_filter|request_method in ('GET','POST')|request_method =}} and status>=400 group by status-
If no value is selected: The query defaults to analyzing the error distribution (status code 400 or higher) for GET and POST requests. The effective query is:
(*)|select status, count(1) as err_count where request_method in ('GET','POST') and status>=400 group by status -
If
'DELETE'is selected: The query switches to analyze errors for theDELETEmethod. The effective query is:(*)| select status, count(1) as err_count where request_method ='DELETE' and status>=400 group by status
-
Procedure
-
Configure the chart. In the chart editing page, configure the time range, Logstore, and a query statement that includes the variable. Select Table as the chart type. Click Apply to preview, and then click OK to save.
The sample query statement is
* | select status, count(1) as err_count where ${{method_filter|request_method in ('GET','POST')|request_method =}} and status>=400 group by status, where${{method_filter|...|...}}is the variable syntax. Set the data source to website_log. -
Configure the variable filter. In the Filter panel, add values to the drop-down list for the
method_filtervariable.Set Type to Variable Replacement. In the static list items section, add
'GET','POST','PUT', and'DELETE'. Then, click OK. -
Filter the dashboard. Click the filter and select
'DELETE'. The dashboard updates and displays statistics based on the(*)| select status, count(1) as err_count where request_method ='DELETE' and status>=400 group by statusquery statement.
Filter a chart: Request time threshold filtering
Variable
-
Variable format:
${{slow_query|request_time>50|request_time>}} -
Query statement:
(*)| select request_uri, avg(request_time) as avg_time where ${{slow_query|request_time>50|request_time>}} group by request_uri order by avg_time desc-
If no value is selected: The query defaults to finding APIs with a request time greater than 50 ms, sorted by average time. The effective query is:
(*)| select request_uri, avg(request_time) as avg_time where request_time>50 group by request_uri order by avg_time desc -
If
1000is selected: The query is adjusted to analyze slow APIs that take longer than 1,000 ms. The effective query is:(*)| select request_uri, avg(request_time) as avg_time where request_time>1000 group by request_uri order by avg_time desc
-
Procedure
-
Configure the chart. In the chart editing page, configure the time range, Logstore, and a query statement that includes the variable.
On the right, select Table as the chart type. In the lower-left panel, edit the query statement to include the variable. In the Variable Replacement section on the right, configure the variable key and display name. When you are finished, click OK.
-
Configure variable replacement. On the right side of the chart editing page, click Variable Replacement. In the Variable Replacement dialog box, add values for the
slow_queryvariable.In the list of variable values, add the following items: display name 50ms (replacement value
50, set as default), 100ms (replacement value100), 200ms (replacement value200), 300ms (replacement value300), 400ms (replacement value400), 500ms (replacement value500), and 1000ms (replacement value1000). Then, click OK. -
Filter the chart. Click the filter in the upper-left corner of the chart. When you select
1000ms, the chart updates and displays statistics based on the(*)| select request_uri, avg(request_time) as avg_time where request_time>1000 group by request_uri order by avg_time descquery statement.