After you develop a device, you can use the Online Debug feature in the IoT Platform console to send commands to the device and test its TSL model functions. This topic describes how to debug TSL model functions.
Prerequisites
-
The device's product must have a defined TSL model. For more information, see Add a TSL model.
-
The device must be connected to IoT Platform, activated, and online. To learn how to develop and connect your device, see Connect a device by using a Link SDK.
NoteYou can also use the device simulator in IoT Platform or a tool like MQTT.fx to simulate an online device. You can then use the Online Debug feature to test the functions of the simulated device. For more information, see Use the device simulator or Connect a device to IoT Platform by using MQTT.fx.
When a simulated device comes online, a device topic is generated. For more information about how to subscribe to and use topics, see Generate device topics.
Limitations
You can debug TSL model functions only for devices that are connected over MQTT.
Procedure
-
Log in to the IoT Platform console.
On the Overview page, find the instance that you want to manage and click the instance ID or instance name.
-
In the left-side navigation pane, choose .
-
On the Online Debug page, select the device to debug.
-
Select the Property Debugging, Service Calls, tab to start debugging.
Property debugging
-
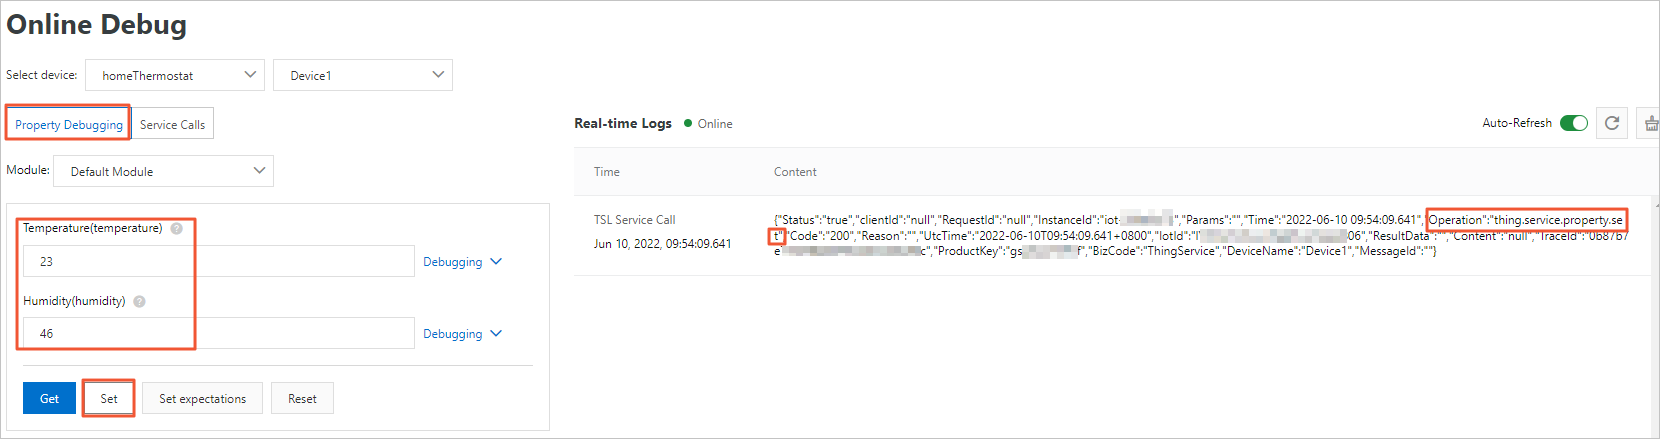
On the Property Debugging tab, select a module from the Module drop-down list.
-
Perform the following operations to debug properties.
ImportantTo use the Set or Set expectations operations, the properties must have read and write permissions.
Function
Operation
Description
Get
To the right of the property field, click Debugging and select Get.
The latest property data from the device is displayed in the input field. If the device has no data for the property, the field is empty.
Set
Enter a value in the property field, click Debugging on the right, and select Set.
IoT Platform sends a command to the device to set the property value. After an online device receives the command, it processes the value based on its TSL model implementation. For example, the device reports the latest property value to IoT Platform.
Set expectations
Enter a value in the property field, click Debugging on the right, and select Set expectations.
IoT Platform sends a command to the device to set a desired property value.
When the command is sent:
-
If the device is online, it immediately receives the command, updates the property value, and reports the new value to IoT Platform.
-
If the device is offline, it proactively obtains the desired value after going online, then updates the property and reports the new value.
You can also click Get, Set, or Set expectations at the bottom of the page to debug multiple properties in a batch.
-
Service calls
-
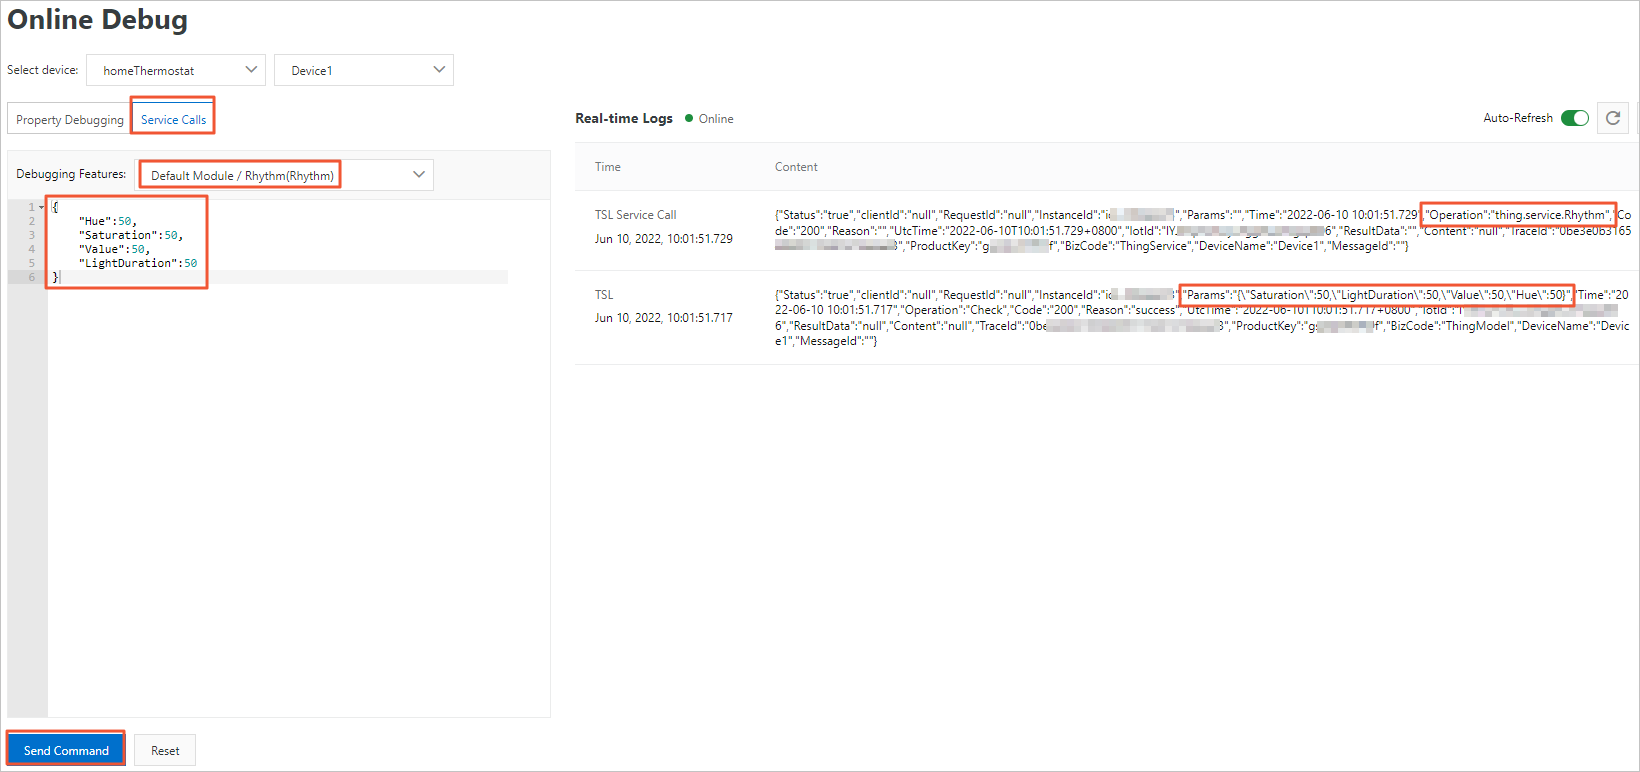
On the Service Calls tab, select the module and the service that you want to debug from the Debug Feature drop-down list.
-
In the input field, enter the parameters for the service call, and then click Send Command.
The input parameters must be in a valid JSON format, such as
{"Switch":0}.
View debugging logs
After you send a command, you can view the operation log in the Real-time Logs section on the right side of the page. You can also view the debugging results on the TSL Data tab of the device details page.
During online debugging, IoT Platform uses a synchronous RRPC mechanism to send commands to devices. As a result, simulated online devices, such as those connected by using MQTT.fx, can receive relevant logs even without subscribing to any device topic. You can view detailed logs on the Maintenance > Device Log page.
-
Property Debugging: Enter a property value and click Set.
The left side of the page shows the list of properties and their current values. The Real-time Logs section on the right displays the device status and operation logs. In the log content, the value of the Operation field is thing.service.property.set, which indicates the platform sent the property setting command.
-
Service Calls: Select a service, enter its input parameters, and click Send Command.
The left side of the page shows the Debug Feature drop-down list and a JSON editor for input parameters, with Send Command and Reset buttons at the bottom. The Real-time Logs section on the right shows the request log for the service call (where the Operation field is the service identifier) and the response from the device.