This topic presents performance benchmark results for Hologres across OLAP query, point query, data import, data update, and real-time ingestion workloads, all tested on Alibaba Cloud public cloud instances.
Summary of key results
Workload | Instance | Result | Trend |
OLAP query (100 GB TPC-H) | 64 CUs | V3.1.3: 10.4 s total | 12% faster than V2.2.19 |
OLAP query (100 GB TPC-H) | 128 CUs | V3.1.3: 7.05 s total | 8% faster than V2.2.19 |
OLAP query (1 TB TPC-H) | 96 CUs | V4.2.0: 62.17 s total | 11% faster than V4.0.4; 39% faster than V3.0.5 |
Key/Value point query | 64 CUs, 500 clients | 112,435 QPS (single-key) | QPS scales linearly with instance size |
Data import (122.4 GB total) | 64 CUs | MaxCompute: 251 s; VPC COPY: 1,167 s | MaxCompute is 4.6x faster than VPC COPY |
Real-time ingestion (Flink) | 64 CUs | Peak 580,234 RPS | — |
100 GB TPC-H benchmark
Test environment
Table row counts
Table | Rows |
LINEITEM | 600,037,902 |
ORDERS | 150,000,000 |
PARTSUPP | 80,000,000 |
PART | 20,000,000 |
CUSTOMER | 15,000,000 |
SUPPLIER | 1,000,000 |
NATION | 25 |
REGION | 5 |
Instance specifications
Computing resource | Zone | Shards | Notes |
64 CUs (64 CPU cores, 256 GB memory) | Hangzhou Zone J | 40 | Default instance configurations |
128 CUs (128 CPU cores, 512 GB memory) | Hangzhou Zone J | 80 | Default instance configurations |
OLAP query performance
All queries run on Hologres internal tables. Execution time is measured in seconds — lower is better. Doubling the compute resources (64 CUs to 128 CUs) reduces execution time proportionally.
V3.1.3 total: 64 CUs — 10.4 s | 128 CUs — 7.05 s. Compared to V2.2.19, V3.1.3 reduces total query time by 12% at 64 CUs and 8% at 128 CUs.
TPC-H query ID | 64 CUs (V3.1.3) | 128 CUs (V3.1.3) | 64 CUs (V2.2.19) | 128 CUs (V2.2.19) | Improvement at 64 CUs |
1 | 0.48 | 0.36 | 0.55 | 0.34 | 13% |
2 | 0.19 | 0.18 | 0.17 | 0.15 | -12% |
3 | 0.43 | 0.28 | 0.38 | 0.29 | -13% |
4 | 0.26 | 0.15 | 0.32 | 0.19 | 19% |
5 | 0.53 | 0.41 | 0.68 | 0.48 | 22% |
6 | 0.10 | 0.12 | 0.10 | 0.08 | 0% |
7 | 0.48 | 0.34 | 0.55 | 0.36 | 13% |
8 | 0.48 | 0.37 | 0.51 | 0.38 | 6% |
9 | 1.52 | 0.91 | 1.62 | 1.00 | 6% |
10 | 0.81 | 0.43 | 0.69 | 0.47 | -17% |
11 | 0.19 | 0.17 | 0.37 | 0.32 | 49% |
12 | 0.19 | 0.14 | 0.22 | 0.15 | 14% |
13 | 0.53 | 0.36 | 0.67 | 0.37 | 21% |
14 | 0.19 | 0.13 | 0.19 | 0.13 | 0% |
15 | 0.34 | 0.19 | 0.36 | 0.23 | 6% |
16 | 0.35 | 0.29 | 0.41 | 0.33 | 15% |
17 | 0.21 | 0.18 | 0.22 | 0.16 | 5% |
18 | 1.57 | 0.89 | 2.02 | 0.94 | 22% |
19 | 0.26 | 0.19 | 0.25 | 0.17 | -4% |
20 | 0.24 | 0.22 | 0.24 | 0.27 | 0% |
21 | 0.79 | 0.56 | 1.03 | 0.63 | 23% |
22 | 0.26 | 0.18 | 0.28 | 0.22 | 7% |
Total | 10.4 | 7.05 | 11.83 | 7.66 | 12% |
Key/Value point query performance
All queries run on Hologres internal tables. Software version: r1.1.42. Each scenario runs continuously for 5 minutes. Queries per second (QPS) scales linearly as instance size increases.
Scenario 1 — single-key lookup
SELECT O_ORDERKEY, O_CUSTKEY, O_ORDERSTATUS, O_TOTALPRICE,
       O_ORDERDATE, O_ORDERPRIORITY, O_CLERK, O_SHIPPRIORITY, O_COMMENT
FROM   public.orders_row
WHERE  o_orderkey = {parameter};
Instance | Concurrent clients | QPS (incl. connection time) | QPS (excl. connection time) | Avg latency |
64 CUs | 500 | 112,435 | 112,443 | 4.447 ms |
128 CUs | 1,000 | 242,755 | 242,772 | 4.119 ms |
Scenario 2 — 9-key IN-clause lookup
SELECT O_ORDERKEY, O_CUSTKEY, O_ORDERSTATUS, O_TOTALPRICE,
       O_ORDERDATE, O_ORDERPRIORITY, O_CLERK, O_SHIPPRIORITY, O_COMMENT
FROM   public.orders_row
WHERE  o_orderkey IN (
    {parameter1}, {parameter2}, {parameter3},
    {parameter4}, {parameter5}, {parameter6},
    {parameter7}, {parameter8}, {parameter9}
);
Instance | Concurrent clients | QPS (incl. connection time) | QPS (excl. connection time) | Avg latency |
64 CUs | 500 | 27,632 | 27,634 | 18.094 ms |
128 CUs | 1,000 | 90,086 | 90,092 | 11.100 ms |
Data write performance
All results use 64 CUs and measure time in seconds to import data into Hologres internal tables.
The COPY statement imports one file into one table at a time. Concurrent import is unavailable with COPY.
Key findings:
Virtual private cloud (VPC) import is significantly faster than Internet import because COPY performance is bandwidth-bound.
Importing via a MaxCompute foreign table is faster than COPY over both network paths.
Table | Rows | Data size | COPY (Internet) | COPY (VPC) | MaxCompute foreign table |
LINEITEM | 600,037,902 | 73.6 GB | 3,070.453 | 694.364 | 148.165 |
ORDERS | 150,000,000 | 16.4 GB | 691.060 | 172.529 | 37.741 |
PARTSUPP | 80,000,000 | 2.3 GB | 468.560 | 107.092 | 18.488 |
PART | 20,000,000 | 11.3 GB | 96.342 | 24.020 | 8.083 |
CUSTOMER | 15,000,000 | 2.3 GB | 95.190 | 22.937 | 10.363 |
SUPPLIER | 1,000,000 | 132 MB | 5.057 | 1.803 | 1.503 |
NATION | 25 | 2 KB | 0.580 | 0.584 | 0.747 |
REGION | 5 | 0.375 KB | 0.168 | 0.153 | 0.430 |
ORDERS_ROW | 150,000,000 | 16.4 GB | 717,653 | 143.800 | 25.676 |
Total | 122.4 GB | 722,080.410 | 1,167.282 | 251.196 |
The bar chart below compares import times across all three methods. Blue bars represent Internet COPY, green bars represent VPC COPY, and gray bars represent MaxCompute foreign table. Lower values indicate faster import.
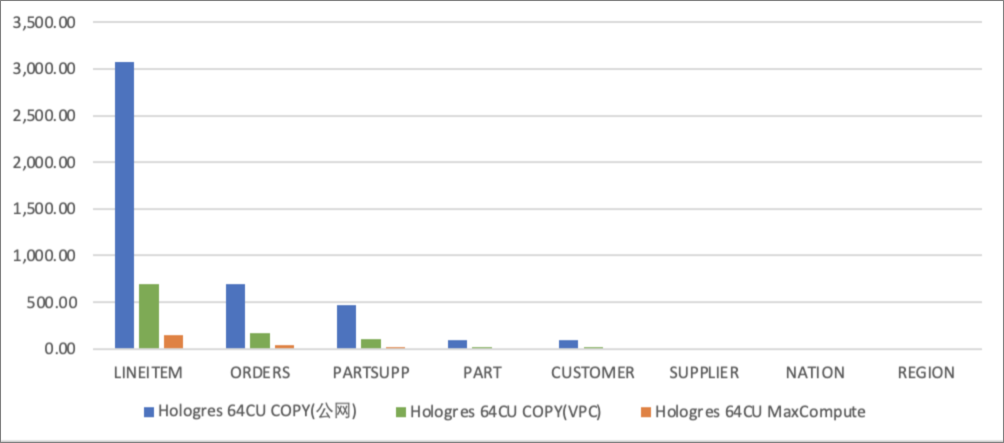
The x-axis represents the table name. The y-axis represents import time in seconds.
Data update performance
All results are based on upsert operations on Hologres internal tables. Software version: r1.1.42. Each scenario runs continuously for 5 minutes. QPS scales linearly as instance size increases.
INSERT INTO public.orders_row(
    o_orderkey, o_custkey, o_orderstatus, o_totalprice,
    o_orderdate, o_orderpriority, o_clerk, o_shippriority, o_comment
) VALUES (
    {parameter}, 1, 'demo', 1.1, '2021-01-01', 'demo', 'demo', 1, 'demo'
)
ON CONFLICT(o_orderkey)
DO UPDATE SET (
    o_orderkey, o_custkey, o_orderstatus, o_totalprice,
    o_orderdate, o_orderpriority, o_clerk, o_shippriority, o_comment
) = ROW(excluded.*);
Instance | Concurrent clients | QPS (incl. connection time) | QPS (excl. connection time) | Avg latency |
64 CUs | 500 | 92,006 | 92,000 | 5.435 ms |
128 CUs | 1,000 | 191,761 | 191,771 | 5.215 ms |
1 TB TPC-H benchmark
Test environment
Table row counts
Table | Rows | Data size |
LINEITEM | 5,999,989,709 | 752.27 GB |
ORDERS | 1,500,000,000 | 167.11 GB |
PARTSUPP | 800,000,000 | 114.45 GB |
PART | 150,000,000 | 22.94 GB |
CUSTOMER | 200,000,000 | 22.85 GB |
SUPPLIER | 10,000,000 | 1.33 GB |
NATION | 25 | 2.15 KB |
REGION | 5 | 0.38 KB |
Test environment configuration
Parameter | Description |
Software version | Hologres V4.2.0 |
Computing resources | 96 CUs (96 CPU cores, 384 GB memory) |
Storage capacity | 1,000 GB |
Shards | 60 |
Test cluster | China (Hangzhou) Zone J |
Machine type | Intel 7th Gen processor |
Test script | Official TPC-H benchmark script |
OLAP query performance
All queries run on Hologres internal tables. Execution time is measured in seconds — lower is better.
V4.2.0 total: 62.17 s — 11% faster than V4.0.4 (69.99 s) and 39% faster than V3.0.5 (101.16 s).
TPC-H query ID | V4.2.0 | V4.0.4 | V3.0.5 |
1 | 2.43 | 3.07 | 8.47 |
2 | 0.31 | 0.34 | 0.36 |
3 | 3.53 | 3.98 | 5.77 |
4 | 1.46 | 1.53 | 1.71 |
5 | 4.67 | 4.55 | 7.65 |
6 | 0.18 | 0.27 | 0.34 |
7 | 1.72 | 3.48 | 3.56 |
8 | 1.98 | 1.97 | 5.61 |
9 | 13.00 | 13.28 | 16.83 |
10 | 3.38 | 4.33 | 5.61 |
11 | 2.21 | 1.79 | 2.23 |
12 | 0.63 | 0.69 | 0.84 |
13 | 4.11 | 4.56 | 5.78 |
14 | 0.69 | 0.78 | 0.79 |
15 | 2.10 | 1.87 | 2.27 |
16 | 1.63 | 2.02 | 1.64 |
17 | 1.06 | 0.93 | 4.64 |
18 | 9.08 | 11.51 | 13.74 |
19 | 0.82 | 0.86 | 3.00 |
20 | 0.82 | 0.76 | 0.95 |
21 | 4.40 | 4.73 | 7.20 |
22 | 1.81 | 2.72 | 2.17 |
Total | 62.17 | 69.99 | 101.16 |
Real-time ingestion with Realtime Compute for Apache Flink
Test environment
Hologres instance
Computing resource | Software version | Shards | Notes |
64 CUs (64 CPU cores, 256 GB memory) | r1.1.53 | 40 | Default instance configurations |
Flink configuration
Parameter | Value |
Engine version | vvr-4.0.12-flink-1.13 |
Configuration mode | Basic mode |
Parallelism | 15 |
JobManager CPU | 1 |
JobManager memory | 1 GiB |
TaskManager CPU | 1 |
TaskManager memory | 6 GiB |
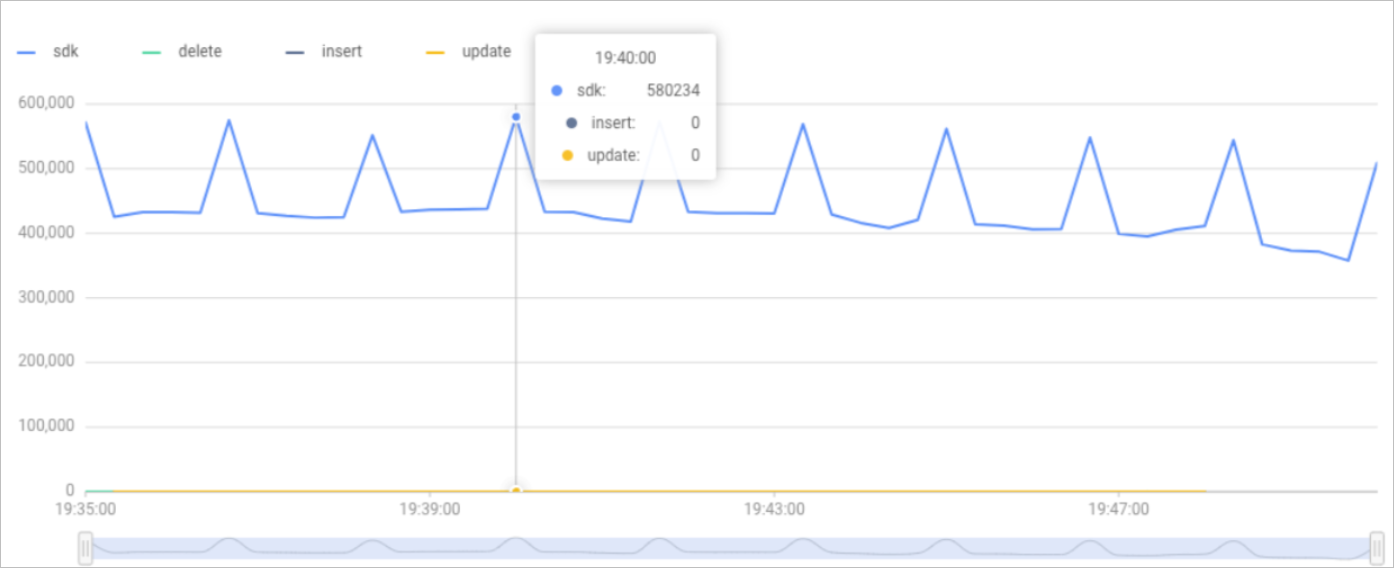
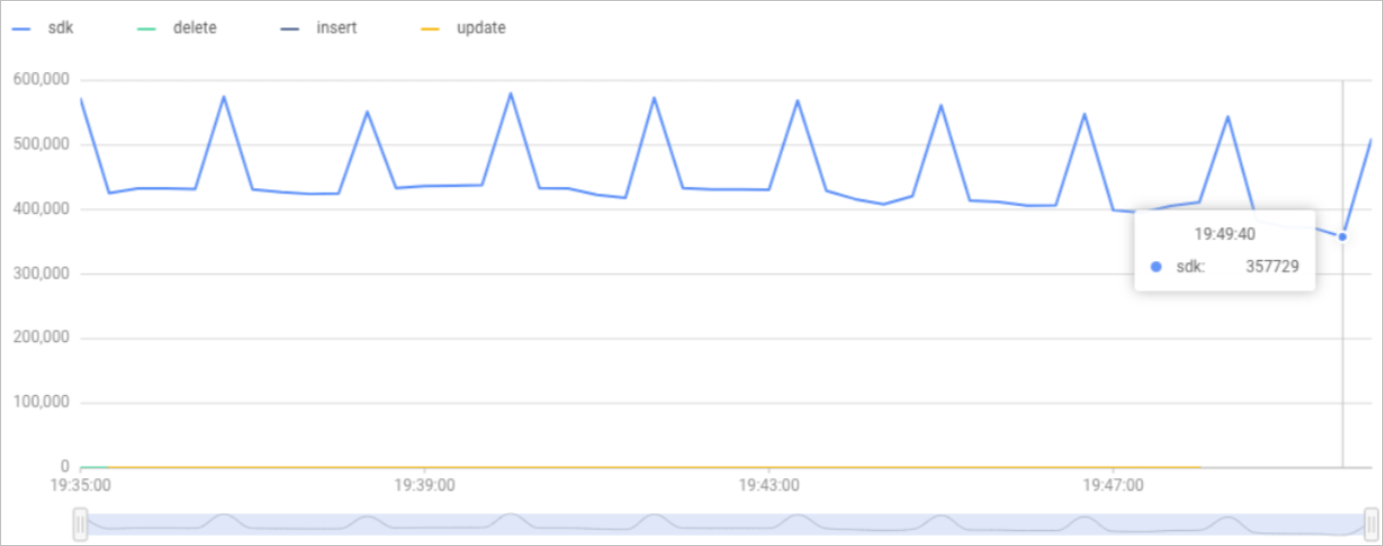
Test results
During the test window from 19:35 to 19:50 on April 8, 2022, the peak records per second (RPS) reached 580,234 and the minimum RPS was 357,729.