Hash joins between a large fact table and a small dimension table often scan far more data than needed: the probe side reads everything and discards most rows at the join operator. Runtime filter solves this by pushing a lightweight filter — built from the build side — down to the probe side scan, so non-matching rows are eliminated before they reach the hash join. This reduces both I/O and network overhead with no manual configuration required.
Runtime filter is available in Hologres V2.0 and later. It is typically used in hash join scenarios that involve two or more tables.
How it works
In a hash join, one side's data is loaded into a hash table. This is the build side. The other side reads data and matches it against the hash table. This is the probe side. The optimizer typically assigns the smaller table to the build side and the larger table to the probe side.
Without Runtime filter: The probe side scans all its data and passes it to the hash join operator, which discards non-matching rows.
With Runtime filter: Hologres builds a lightweight filter from the build side data distribution and pushes it down to the probe side scan. The probe side discards non-matching rows before they reach the hash join — reducing both I/O and network traffic.
Runtime filter is most effective when the build side is much smaller than the probe side. The lower the build-to-probe ratio, the greater the performance gain.
SELECT * FROM test1 JOIN test2 ON test1.x = test2.x;The corresponding execution plan:
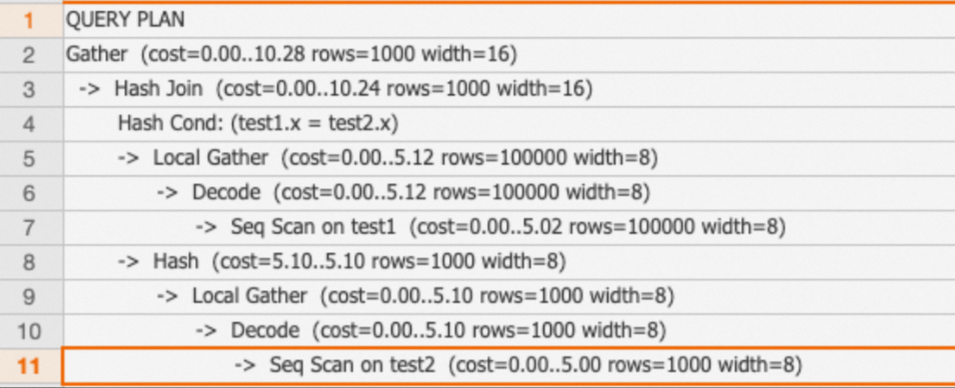
Version requirements and limitations
| Constraint | Details |
|---|---|
| Minimum version | Hologres V2.0 |
| Join condition (V2.0) | Single-column join conditions only |
| Join condition (V2.1+) | Multi-column join conditions supported |
| TopN Runtime filter | Hologres V4.0 or later |
Trigger conditions
The engine applies Runtime filter automatically when all three conditions are met:
| Condition | Threshold |
|---|---|
| Probe side row count | 100,000 rows or more |
| Scanned data ratio (build / probe) | 0.1 or less |
| Joined data ratio (build / probe) | 0.1 or less |
The lower the ratio, the more likely Runtime filter is to trigger.
Types of Runtime filter
Runtime filter has two classification dimensions: distribution scope and filter mechanism.
By distribution scope
| Type | Version | When it applies |
|---|---|---|
| Local | V2.0+ | The probe side does not require a shuffle. Applies when: the join keys have the same data distribution on both sides; the build side is broadcast to the probe side; or the build side is shuffled based on the probe side's distribution. Reduces scanned data volume and data processed by the hash join. |
| Global | V2.2+ | The probe side requires a shuffle. Filters from multiple workers are merged before being applied to the probe side, reducing network traffic in addition to I/O. |
The engine selects Local or Global automatically based on the execution plan.
By filter mechanism
| Type | Version | How it works | Best for |
|---|---|---|---|
| Bloom filter | V2.0+ | Builds a probabilistic filter from build side data. May pass some non-matching rows (false positives), but achieves high filtering efficiency even with a large build side. | General-purpose joins with large build side data |
| In filter | V2.0+ | Builds a HashSet from build side data when the Number of Distinct Values (NDV) is small. Supports precise filtering and can be combined with a bitmap index. | Small NDV on the build side; STRING join keys with a bitmap index |
| MinMax filter | V2.0+ | Extracts the min and max values from the build side and uses them to skip entire data blocks based on metadata — without reading those blocks. | Numeric join keys; data with range-correlated values |
The engine selects the filter mechanism automatically at runtime.
Verify Runtime filter is applied
Use EXPLAIN ANALYZE to confirm Runtime filter is active. Look for Runtime Filter Target Expr on the probe side's scan operator — this confirms the filter was pushed down.
Example 1: Local Runtime filter with a single-column join condition
BEGIN;
CREATE TABLE test1(x INT, y INT);
CALL set_table_property('test1', 'distribution_key', 'x');

CREATE TABLE test2(x INT, y INT);
CALL set_table_property('test2', 'distribution_key', 'x');
END;

INSERT INTO test1 SELECT t, t FROM generate_series(1, 100000) t;
INSERT INTO test2 SELECT t, t FROM generate_series(1, 1000) t;
ANALYZE test1;
ANALYZE test2;

EXPLAIN ANALYZE SELECT * FROM test1 JOIN test2 ON test1.x = test2.x;
Execution plan:
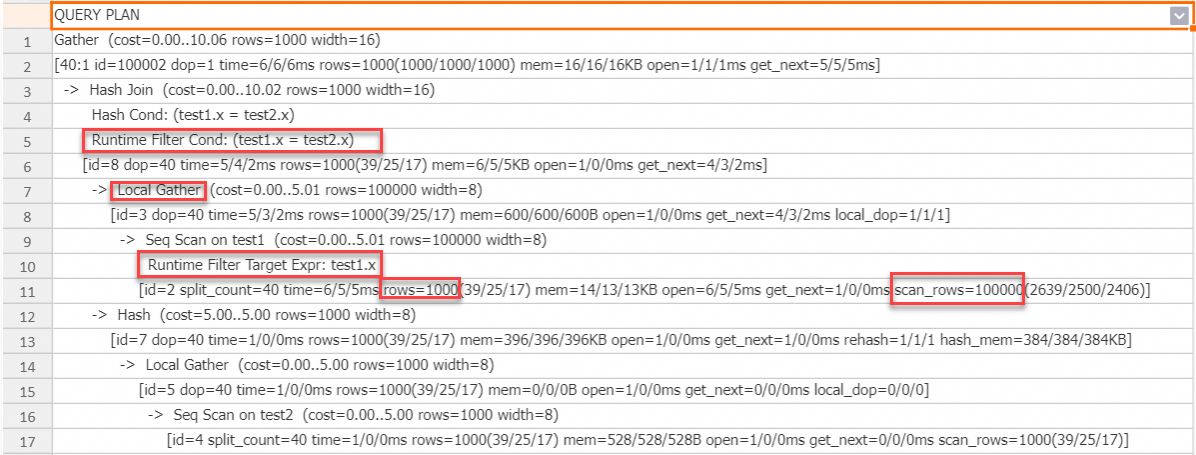
test2has 1,000 rows (build side);test1has 100,000 rows (probe side). The build-to-probe ratio is 0.01, well below the 0.1 threshold — Runtime filter triggers automatically.The probe side scan shows
Runtime Filter Target Expr, confirming the filter was pushed down.scan_rowson the probe side is 100,000 (rows read from storage).rowsafter the filter is 1,000. The difference shows how many rows were eliminated before the hash join.
Example 2: Local Runtime filter with a multi-column join condition (V2.1+)
DROP TABLE IF EXISTS test1, test2;
BEGIN;
CREATE TABLE test1(x INT, y INT);
CREATE TABLE test2(x INT, y INT);
END;

INSERT INTO test1 SELECT t, t FROM generate_series(1, 1000000) t;
INSERT INTO test2 SELECT t, t FROM generate_series(1, 1000) t;
ANALYZE test1;
ANALYZE test2;

EXPLAIN ANALYZE SELECT * FROM test1 JOIN test2 ON test1.x = test2.x AND test1.y = test2.y;
Execution plan:
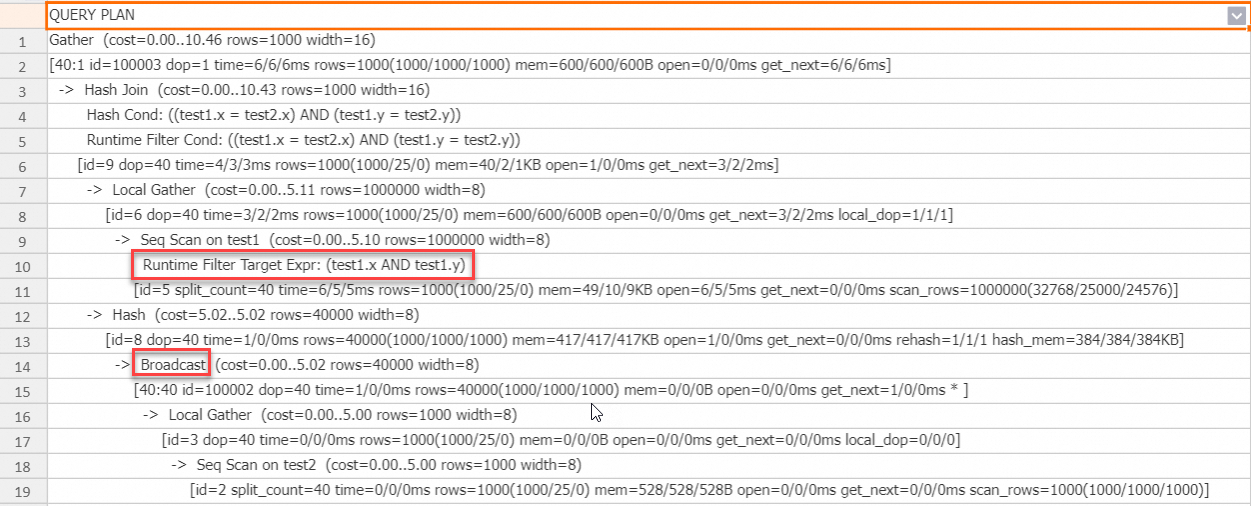
Runtime filter is generated for both join columns. Because the build side is broadcast to the probe side, a Local Runtime filter applies.
Example 3: Global Runtime filter for a shuffle join (V2.2+)
SET hg_experimental_enable_result_cache = OFF;

DROP TABLE IF EXISTS test1, test2;
BEGIN;
CREATE TABLE test1(x INT, y INT);
CREATE TABLE test2(x INT, y INT);
END;

INSERT INTO test1 SELECT t, t FROM generate_series(1, 100000) t;
INSERT INTO test2 SELECT t, t FROM generate_series(1, 1000) t;
ANALYZE test1;
ANALYZE test2;

EXPLAIN ANALYZE SELECT * FROM test1 JOIN test2 ON test1.x = test2.x;
Execution plan:
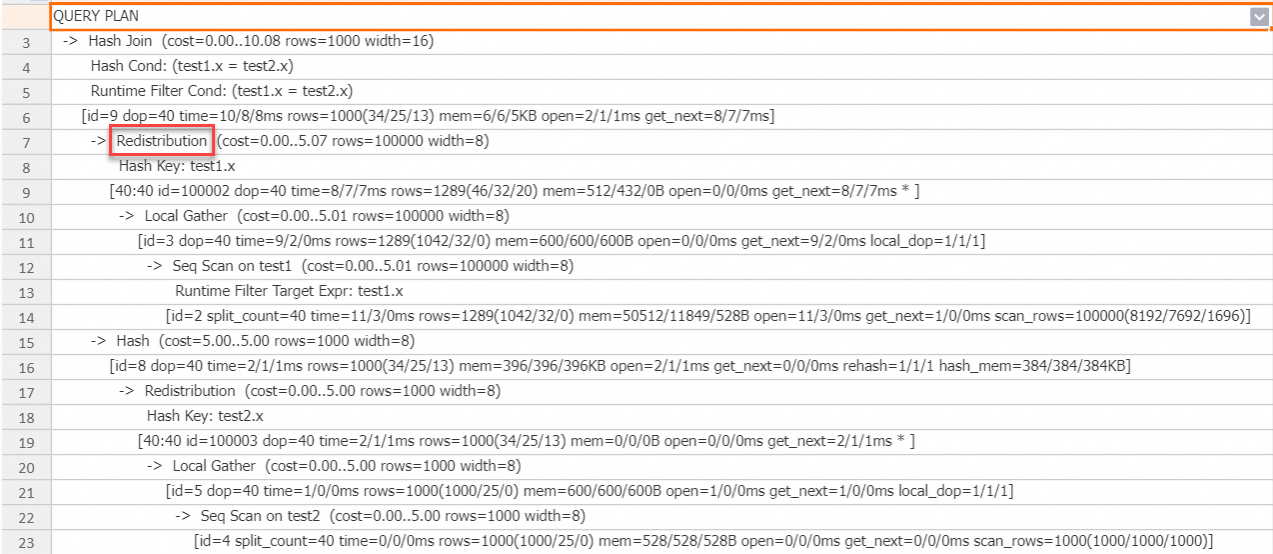
Neither table has a distribution key, so the probe side data is shuffled to the hash join operator. The engine automatically uses a Global Runtime filter to filter data before the shuffle, reducing network traffic.
Example 4: In filter combined with a bitmap index (V2.2+)
An In filter can be combined with a bitmap index for precise, storage-level filtering — most effective for STRING join keys.
SET hg_experimental_enable_result_cache = OFF;

DROP TABLE IF EXISTS test1, test2;

BEGIN;
CREATE TABLE test1(x TEXT, y TEXT);
CALL set_table_property('test1', 'distribution_key', 'x');
CALL set_table_property('test1', 'bitmap_columns', 'x');
CALL set_table_property('test1', 'dictionary_encoding_columns', '');

CREATE TABLE test2(x TEXT, y TEXT);
CALL set_table_property('test2', 'distribution_key', 'x');
END;

INSERT INTO test1 SELECT t::TEXT, t::TEXT FROM generate_series(1, 10000000) t;
INSERT INTO test2 SELECT t::TEXT, t::TEXT FROM generate_series(1, 50) t;
ANALYZE test1;
ANALYZE test2;

EXPLAIN ANALYZE SELECT * FROM test1 JOIN test2 ON test1.x = test2.x;
Execution plan:
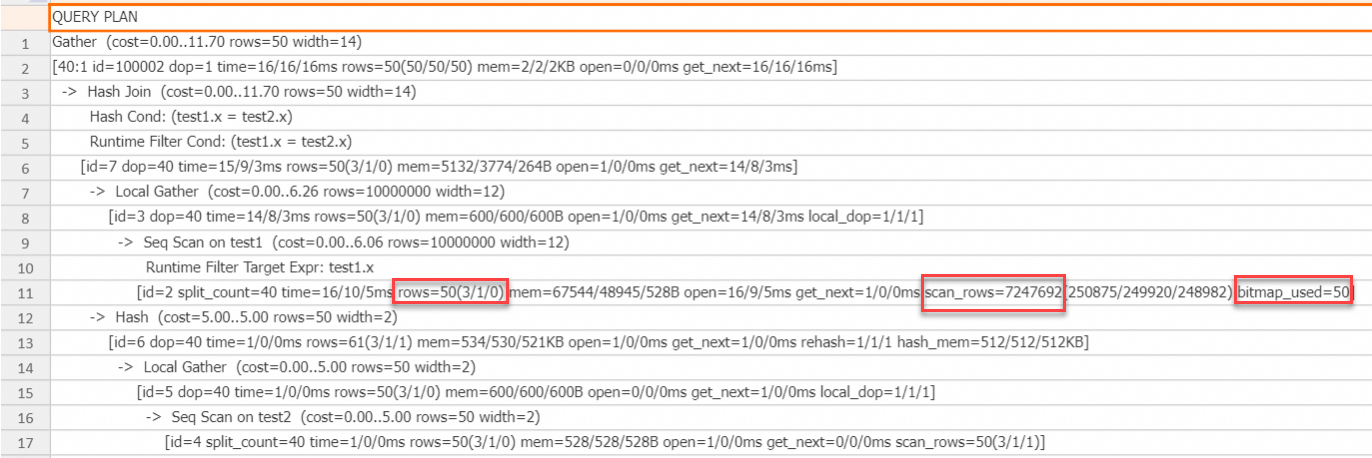
The build side has 50 rows (NDV = 50), so the engine builds a precise HashSet and pushes it to the storage engine via the bitmap index. The In filter provides precise filtering, reducing the output to exactly 50 rows. scan_rows drops from 10 million to over 7 million — this reduction occurs because the In filter is pushed down to the storage engine, which reduces I/O costs.
Example 5: MinMax filter for I/O reduction (V2.2+)
A MinMax filter pushes the min and max values from the build side to the storage engine, which skips entire data blocks whose value ranges fall outside that range — without reading those blocks.
SET hg_experimental_enable_result_cache = OFF;

DROP TABLE IF EXISTS test1, test2;

BEGIN;
CREATE TABLE test1(x INT, y INT);
CALL set_table_property('test1', 'distribution_key', 'x');

CREATE TABLE test2(x INT, y INT);
CALL set_table_property('test2', 'distribution_key', 'x');
END;

INSERT INTO test1 SELECT t::INT, t::INT FROM generate_series(1, 10000000) t;
INSERT INTO test2 SELECT t::INT, t::INT FROM generate_series(1, 100000) t;
ANALYZE test1;
ANALYZE test2;

EXPLAIN ANALYZE SELECT * FROM test1 JOIN test2 ON test1.x = test2.x;
Execution plan:
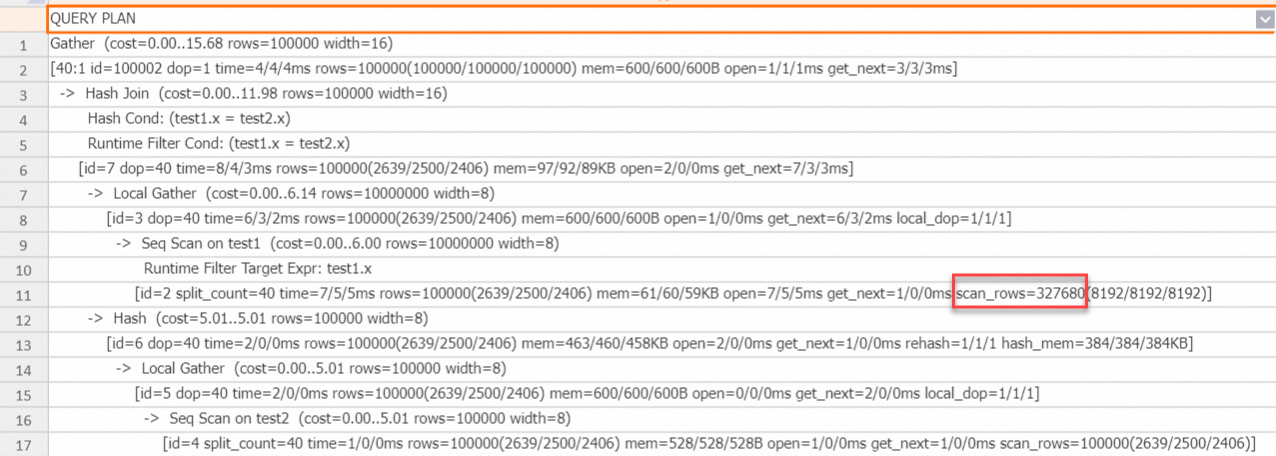
scan_rows drops from 10 million to about 320,000. The MinMax filter uses block metadata to skip blocks whose value range falls outside the build side's min–max range. This is most effective when the join key is numeric and the build side's value range is narrower than the probe side's.
Example 6: TopN Runtime filter (V4.0+)
TopN Runtime filter improves single-table queries that combine ORDER BY with LIMIT. Hologres processes data block by block in a streaming fashion. After each block, the engine uses the Nth-ranked sort key value as a dynamic threshold and skips subsequent blocks that cannot contain a better result.
SELECT o_orderkey FROM orders ORDER BY o_orderdate LIMIT 5;Execution plan (abridged):
QUERY PLAN
Limit  (cost=0.00..116554.70 rows=0 width=8)
  ->  Sort  (cost=0.00..116554.70 rows=100 width=12)
        Sort Key: o_orderdate
      [id=6 dop=1 time=317/317/317ms rows=5(5/5/5) mem=1/1/1KB open=317/317/317ms get_next=0/0/0ms]
        ->  Gather  (cost=0.00..116554.25 rows=100 width=12)
            [20:1 id=100002 dop=1 time=317/317/317ms rows=100(100/100/100) mem=6/6/6KB open=0/0/0ms get_next=317/317/317ms * ]
              ->  Limit  (cost=0.00..116554.25 rows=0 width=12)
                    ->  Sort  (cost=0.00..116554.25 rows=150000000 width=12)
                          Sort Key: o_orderdate
                          Runtime Filter Sort Column: o_orderdate
                        [id=3 dop=20 time=318/282/258ms rows=100(5/5/5) mem=96/96/96KB open=318/282/258ms get_next=1/0/0ms]
                          ->  Local Gather  (cost=0.00..9.59 rows=150000000 width=12)
                              [id=2 dop=20 time=316/280/256ms rows=1372205(68691/68610/68498) mem=0/0/0B open=0/0/0ms get_next=316/280/256ms local_dop=1/1/1 * ]
                                ->  Seq Scan on orders  (cost=0.00..8.24 rows=150000000 width=12)
                                      Runtime Filter Target Expr: o_orderdate
                                    [id=1 split_count=20 time=286/249/222ms rows=1372205(68691/68610/68498) mem=179/179/179KB open=0/0/0ms get_next=286/249/222ms physical_reads=27074(1426/1353/1294) scan_rows=144867963(7324934/7243398/7172304)]
Query id:[1001003033996040311]
QE version: 2.0
Query Queue: init_warehouse.default_queue
======================cost======================
Total cost:[343] ms
Optimizer cost:[13] ms
Build execution plan cost:[0] ms
Init execution plan cost:[6] ms
Start query cost:[6] ms
- Queue cost: [0] ms
- Wait schema cost:[0] ms
- Lock query cost:[0] ms
- Create dataset reader cost:[0] ms
- Create split reader cost:[0] ms
Get result cost:[318] ms
- Get the first block cost:[318] ms
====================resource====================
Memory: total 7 MB. Worker stats: max 3 MB, avg 3 MB, min 3 MB, max memory worker id: 189*****.
CPU time: total 5167 ms. Worker stats: max 2610 ms, avg 2583 ms, min 2557 ms, max CPU time worker id: 189*****.
DAG CPU time stats: max 5165 ms, avg 2582 ms, min 0 ms, cnt 2, max CPU time dag id: 1.
Fragment CPU time stats: max 5137 ms, avg 1721 ms, min 0 ms, cnt 3, max CPU time fragment id: 2.
Ec wait time: total 90 ms. Worker stats: max 46 ms, max(max) 2 ms, avg 45 ms, min 44 ms, max ec wait time worker id: 189*****, max(max) ec wait time worker id: 189*****.
Physical read bytes: total 799 MB. Worker stats: max 400 MB, avg 399 MB, min 399 MB, max physical read bytes worker id: 189*****.
Read bytes: total 898 MB. Worker stats: max 450 MB, avg 449 MB, min 448 MB, max read bytes worker id: 189*****.
DAG instance count: total 3. Worker stats: max 2, avg 1, min 1, max DAG instance count worker id: 189*****.
Fragment instance count: total 41. Worker stats: max 21, avg 20, min 20, max fragment instance count worker id: 189*****.
The Sort node shows Runtime Filter Sort Column: o_orderdate, and the Seq Scan node shows Runtime Filter Target Expr: o_orderdate. This confirms TopN Runtime filter is active.
How the threshold updates dynamically:
Each data block contains about 8,192 rows. After the first block is processed, the Sort node identifies the 5th-ranked o_orderdate — for example, 1995-01-01. When the Scan node reads the second block, it sends only rows where o_orderdate <= 1995-01-01 to the Sort node. If the 5th-ranked value in the second block is smaller than the current threshold, the Sort node updates the threshold to the new, smaller value. This process repeats for every subsequent block.