Hologres V0.10 and later lets you query and analyze slow queries, helping you diagnose and optimize any slow or failed query. This topic describes how to use the visual interface to view and analyze historical slow queries.
Limitations
This feature is available only for Hologres instances of V0.10 or later. You can view the version of your instance on the instance details page in the Hologres console. If your instance is an earlier version, upgrade it. For assistance, see Troubleshoot upgrade preparation failures or join the Hologres DingTalk group for support. For more information, see How can I get more online support?.
To ensure system stability and prevent traffic overload, each search returns a maximum of 2,000 slow query logs.
HoloWeb stores and displays historical slow query logs for a maximum of seven days.
The Historical Slow Queries page applies a filter
engine_type != '{PG}'by default, which excludes query logs from the PostgreSQL (PG) query engine. This filter cannot be modified. To view query logs for all engine types, query thehologres.hg_query_logtable directly by using SQL.
View slow queries
Log in to the HoloWeb console and click Diagnostics and Optimization in the top navigation bar.
In the left-side navigation pane, click Historical Slow Query.
On the Historical Slow Query page, set the following filters.

Parameter
Required
Description
Instance name
Yes
The name of the instance whose slow queries you want to analyze. The system selects the current instance by default.
Database
No
The name of the database whose slow queries you want to analyze. You must have the required permissions on the database to view its logs. Otherwise, you can view only logs associated with your Alibaba Cloud account.
Table name
No
The name of the table whose slow queries you want to view. You must have the required permissions on the table to view its logs. Otherwise, you can view only logs associated with your Alibaba Cloud account.
User
No
The Alibaba Cloud account that ran the query.
Queried rows
Yes
The maximum number of slow query logs to return. The limit is 2,000.
Duration
No
The execution duration of the SQL statement. By default, Hologres collects queries that run for more than 1 second.
Chart dimension
No
Specifies the chart dimension for the Query Trend Analysis chart. You can select either slow query or failed query.
Query
No
The SQL text to search for. You can use the percent sign (%) as a wildcard for fuzzy matching.
Type
No
The type of query, such as DDL or DML.
Query ID
No
The unique identifier for the query.
Virtual Warehouse
Yes
The Virtual Warehouse that ran the query.
Time range
Yes
The time range for the search. The default is the last 10 minutes, and the maximum range is seven days.
After you configure the filters, click Search to view the Query Trend Analysis and query list. For more information, see View the Query Trend Analysis and query list.
Query trend analysis and query list
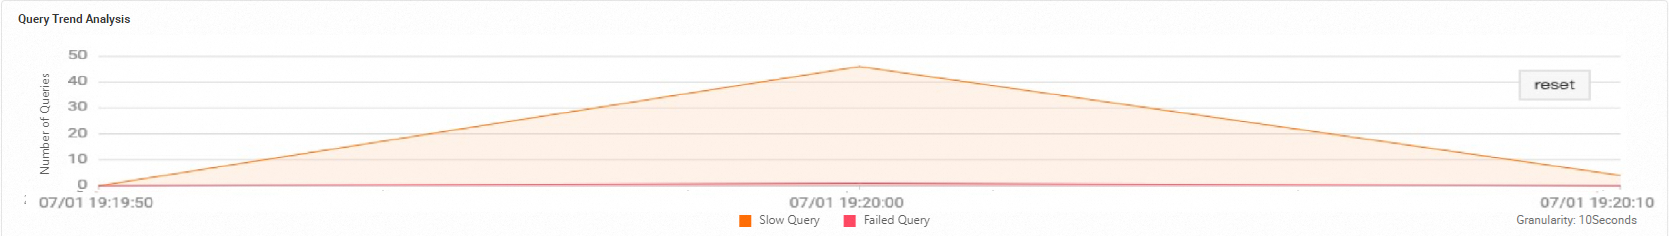
Query Trend Analysis
Analyze queries around a specific point in time.
Click a point on the trend chart to view data from the ten seconds before and after that point.
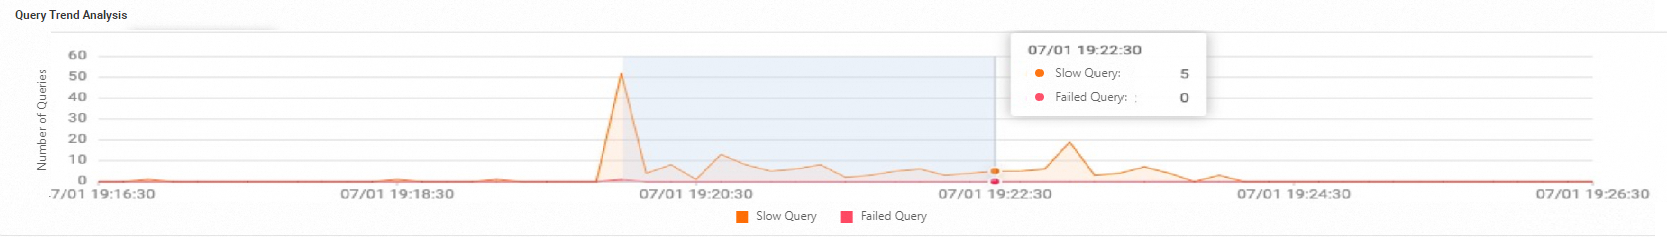
Analyze queries within a selected time range.
Click and drag to select a time range on the chart. The chart then shows data only for that period.
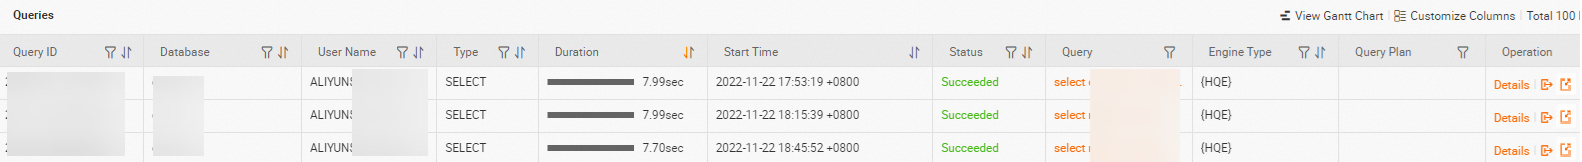
Query list
Review the default columns.
The query list includes a default set of columns, which are described in the following table.
Parameter
Description
Query ID
The unique identifier for the query.
Database
The name of the database where the query was run.
User name
The user who ran the query.
Type
The operation type of the SQL statement.
Duration
The total query execution duration, including time for optimization, startup, and returning results.
Start time
The time the query started.
Status
The execution status of the query.
Query
The SQL text. Click to view the full query.
Engine type
The query engine type.
Query plan
The execution plan for the query.
Actions
Details: View detailed query information for optimization.
 : Open the query in a new SQL editor.
 : Go to the Query Insight page.
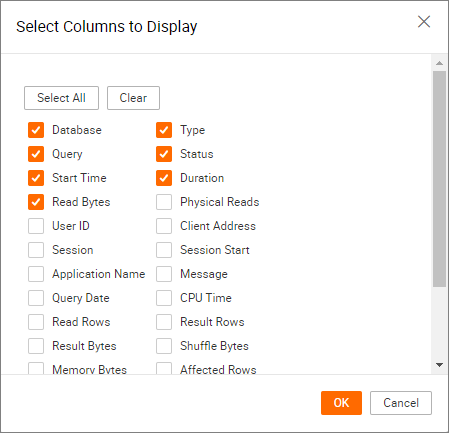
Customize columns.
If the default columns are insufficient, click Customize Columns in the upper-right corner of the query list to select additional columns for display.
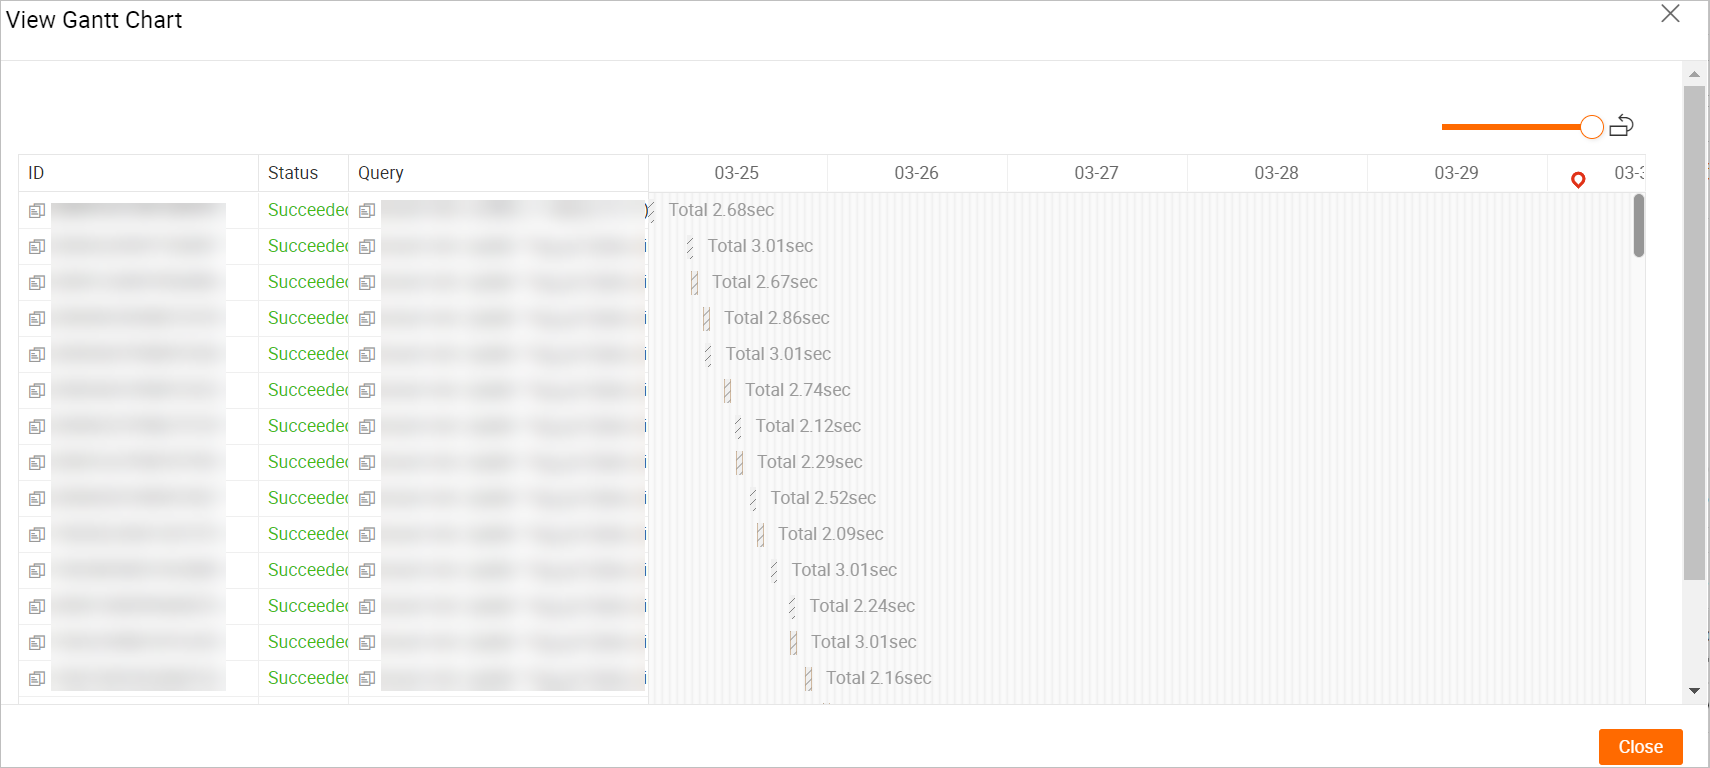
View the gantt chart
Click View Gantt Chart in the upper-right corner of the query list. The resulting chart shows the concurrent execution of queries over time, helping you identify performance bottlenecks in high-concurrency scenarios.