The roaring bitmap algorithm works well for attribute tag queries but falls short when analyzing numeric behavior tags — such as GMV, page views, or order amounts — across large user groups. It also struggles with high-cardinality tags, where storage grows significantly after deduplication. Hologres provides the bit-sliced index (BSI) algorithm to address these limitations: BSI pre-computes and compresses numeric tag values, letting you run sum, distribution, and top-K queries without joining back to detail tables.
When to use BSI
Use BSI when roaring bitmaps alone cannot meet your needs:
Numeric behavior tag analysis: Queries on numeric tags such as GMV, order amount, or playback duration require joining detail tables when using roaring bitmaps alone, which increases query latency. BSI pre-computes and compresses these values, eliminating the join.
High-cardinality tag queries: When a tag has many distinct values after deduplication, roaring bitmaps consume significant storage and slow down queries. BSI stores all user tag values as a maximum of 32 bit slices, keeping storage compact and queries fast.
How BSI works
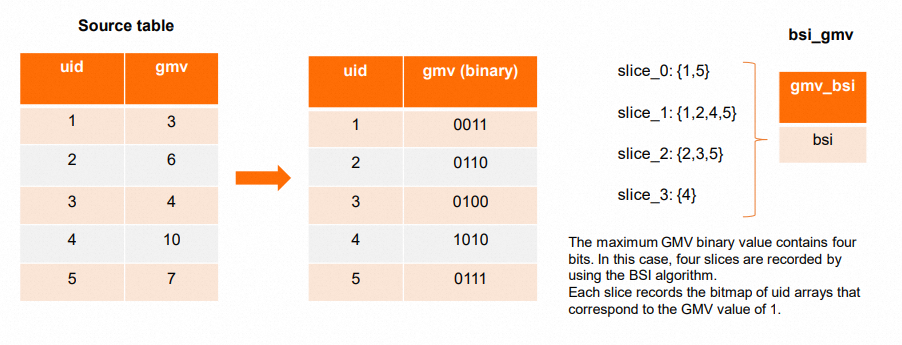
BSI encodes numeric tag values in binary and distributes user IDs (UIDs) across bit slices. Each slice corresponds to a bit position in the binary representation of the tag value.
Given this encoding:
A sum operation becomes a bitmap intersection across all slices.
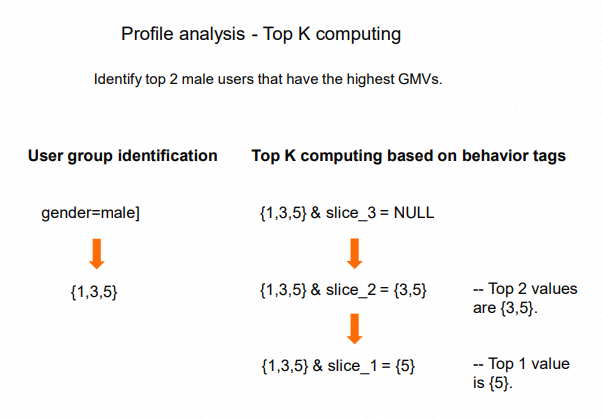
A top-K operation becomes a bitmap intersection starting from the highest-order bits.
BSI combines with roaring bitmap operations (AND, OR, NOT) to enable fast association analysis between attribute tags and behavior tags.
For the full function reference, see BSI functions.
Usage notes
UID type requirement: BSI requires UID values of the
INTtype. For non-integer UIDs, create a dictionary encoding table (such asdws_uid_dict) to map UIDs to integerencode_uidvalues before building BSI data.Resource distribution: Without bucketing, BSI and roaring bitmap tables are placed on specific nodes, leaving other instance resources idle. For production workloads with large datasets, use the bucketing approach described in Advanced practices: bucketing.
Cross-bucket aggregation: The
bsi_add_aggfunction aggregates BSI data across multiple buckets before applyingbsi_topkorbsi_stat. Always use it in bucketed queries.
Basic practices
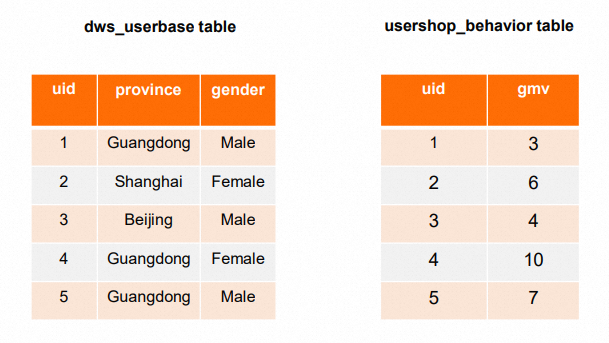
This example uses two source tables:
dws_userbase: user attribute tags (province, gender)usershop_behavior: user behavior tags (GMV = Gross Merchandise Volume)
Set up tables
| Table | Fields | Description |
|---|---|---|
dws_userbase | uid int, province text, gender text | Source attribute tag table (same as wide table solution) |
dws_uid_dict | encode_uid serial, uid int | UID dictionary encoding table (same as roaring bitmap solution) |
usershop_behavior | uid int, gmv int | Source behavior tag table |
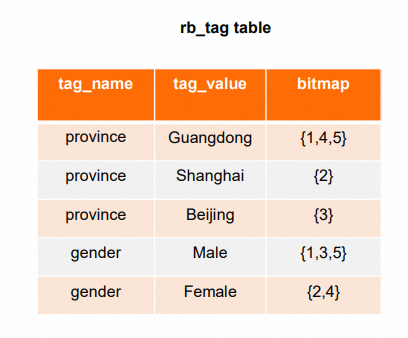
rb_tag | tag_name text, tag_val text, bitmap roaringbitmap | Attribute tag table built on roaring bitmap |
bsi_gmv | gmv_bsi bsi | GMV metric table built on BSI |
Create the tables with the following Data Definition Language (DDL) statements:
CREATE TABLE dws_userbase (
    uid int NOT NULL PRIMARY KEY,
    province text,
    gender text
    ... -- Other attribute columns.
)
WITH (
    distribution_key = 'uid'
);

CREATE TABLE dws_uid_dict (
    encode_uid serial,
    uid int PRIMARY KEY
);

CREATE TABLE usershop_behavior (
    uid int NOT NULL,
    gmv int
)
WITH (
    distribution_key = 'uid'
);

CREATE TABLE rb_tag (
    tag_name text,
    tag_val text,
    bitmap roaringbitmap
);

CREATE TABLE bsi_gmv (
    gmv_bsi bsi
);
Load data
Step 1. Build roaring bitmaps for attribute tags (province and gender) from dws_userbase and dws_uid_dict, and insert them into rb_tag.
INSERT INTO rb_tag
SELECT
    'province',
    province,
    rb_build_agg(b.encode_uid) AS bitmap
FROM
    dws_userbase a
    JOIN dws_uid_dict b ON a.uid = b.uid
GROUP BY
    province;

INSERT INTO rb_tag
SELECT
    'gender',
    gender,
    rb_build_agg(b.encode_uid) AS bitmap
FROM
    dws_userbase a
    JOIN dws_uid_dict b ON a.uid = b.uid
GROUP BY
    gender;
Step 2. Build BSI data for GMV behavior tags from usershop_behavior and dws_uid_dict, and insert it into bsi_gmv.
INSERT INTO bsi_gmv
SELECT
    bsi_build(array_agg(b.encode_uid), array_agg(a.gmv)) AS bitmap
FROM
    usershop_behavior a
    JOIN dws_uid_dict b ON a.uid = b.uid;
Run profile analysis
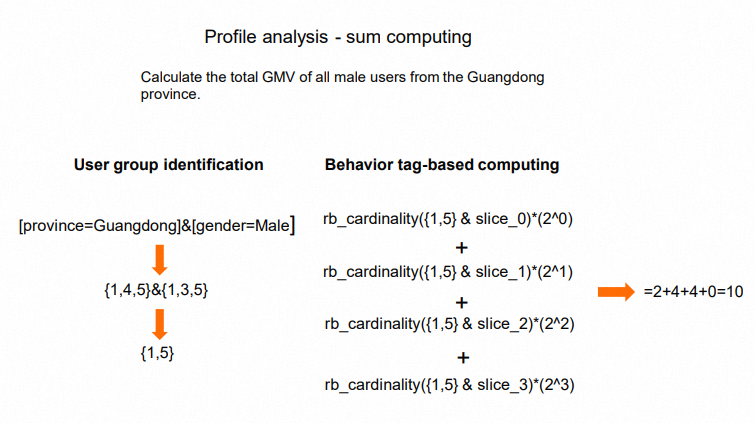
Use BSI with roaring bitmap operations to analyze behavior tags for identified user groups. The following queries target male users from Guangdong province. Each query shows the BSI approach alongside the equivalent plain SQL for comparison.
Analyze behavior tags for a user group
Query total GMV and average GMV
BSI approach:
SELECT
    sum(kv[1]) AS total_gmv,          -- Total GMV.
    sum(kv[1])/sum(kv[2]) AS avg_gmv  -- Average GMV.
FROM (
    SELECT
        bsi_sum(t1.gmv_bsi, t2.crowd) AS kv
    FROM
        bsi_gmv t1,
        (SELECT rb_and(a.bitmap, b.bitmap) AS crowd FROM
            (SELECT bitmap FROM rb_tag WHERE tag_name = 'gender' AND tag_val = 'Male ') a,  -- Male users.
            (SELECT bitmap FROM rb_tag WHERE tag_name = 'province' AND tag_val = 'Guangdong') b  -- Users from Guangdong province.
        ) t2
    ) t;
Plain SQL:
SELECT
    sum(b.gmv) AS total_gmv,
    avg(b.gmv) AS avg_gmv
FROM
    dws_userbase a
    JOIN usershop_behavior b ON a.uid = b.uid
WHERE
    a.province = 'Guangdong'
    AND a.gender = 'Male';
Query GMV distribution
BSI approach — use bsi_stat with boundary values {100, 300, 500} to compute distribution across multiple ranges in one pass:
SELECT
    bsi_stat('{100,300,500}', filter_bsi)
FROM (
    SELECT
        bsi_filter(t1.gmv_bsi, t2.crowd) AS filter_bsi
    FROM
        bsi_gmv t1,
        (SELECT rb_and(a.bitmap, b.bitmap) AS crowd FROM
            (SELECT bitmap FROM rb_tag WHERE tag_name = 'gender' AND tag_val = 'Male ') a,  -- Male users.
            (SELECT bitmap FROM rb_tag WHERE tag_name = 'province' AND tag_val = 'Guangdong') b  -- Users from Guangdong province.
        ) t2
    ) t;
Plain SQL — requires a CASE WHEN expression for each range:
SELECT
    CASE
        WHEN gmv >= 0 AND gmv <= 100 THEN '0-100'
        WHEN gmv > 100 AND gmv <= 300 THEN '100-300'
        WHEN gmv > 300 AND gmv <= 500 THEN '300-500'
        WHEN gmv > 500 THEN '>500'
    END AS gmv_range,
    COUNT(*) AS user_count
FROM
    dws_userbase a
    JOIN usershop_behavior b ON a.uid = b.uid
WHERE a.province = 'Guangdong'
    AND a.gender = 'Male'
GROUP BY gmv_range
ORDER BY gmv_range;
Query top K GMV values
BSI approach:
SELECT
    rb_to_array(bsi_topk(filter_bsi, 10))
FROM (
    SELECT
        bsi_filter(t1.gmv_bsi, t2.crowd) AS filter_bsi
    FROM
        bsi_gmv t1,
        (SELECT rb_and(a.bitmap, b.bitmap) AS crowd FROM
            (SELECT bitmap FROM rb_tag WHERE tag_name = 'gender' AND tag_val = 'Male ') a,  -- Male users.
            (SELECT bitmap FROM rb_tag WHERE tag_name = 'province' AND tag_val = 'Guangdong') b  -- Users from Guangdong province.
        ) t2
    ) t;
Plain SQL:
SELECT
    b.uid,
    b.gmv
FROM
    dws_userbase a
    JOIN usershop_behavior b ON a.uid = b.uid
WHERE
    a.province = 'Guangdong'
    AND a.gender = 'Male'
ORDER BY gmv DESC
LIMIT 10;
Filter users by behavior tag
Identify users whose GMV exceeds 1,000
BSI approach:
SELECT
    rb_to_array(bsi_gt(gmv_bsi, 1000)) AS crowd
FROM
    bsi_gmv;
Plain SQL:
SELECT
    array_agg(uid)
FROM
    usershop_behavior
WHERE
    gmv > 800;
Advanced practices: bucketing
Without bucketing, BSI and roaring bitmap tables land on specific nodes, leaving the rest of the instance underutilized. Splitting these tables into 65,536 segments distributes data across all nodes, increasing query concurrency and resource efficiency.
The bucket assignment formula is encode_uid / 65536 AS bucket. Both rb_tag and bsi_gmv use bucket as the distribution key so that corresponding segments from each table always colocate on the same node.
Set up tables
Compared to the basic setup, the advanced setup adds a bucket column to rb_tag and bsi_gmv, and adds category and ds columns to bsi_gmv for time-partitioned, category-level queries.
| Table | Fields | Description |
|---|---|---|
dws_userbase | uid int, province text, gender text | Same as basic practices |
dws_uid_dict | encode_uid serial, uid int | Same as basic practices |
usershop_behavior | uid int, category text, gmv int, ds date | Adds category and ds vs. basic |
rb_tag | tag_name text, tag_val text, bucket int, bitmap roaringbitmap | Adds bucket; distribution key is bucket |
bsi_gmv | ds date, category text, bucket int, gmv_bsi bsi | Adds category, ds, bucket; distribution key is bucket |
CREATE TABLE rb_tag (
    tag_name text,
    tag_val text,
    bucket int,
    bitmap roaringbitmap
)
WITH (
    distribution_key = 'bucket'  -- Use the bucket ID as the distribution key.
);

CREATE TABLE bsi_gmv (
    category text,
    bucket int,
    gmv_bsi bsi,
    ds date
)
WITH (
    distribution_key = 'bucket'  -- Use the bucket ID as the distribution key.
);
Load data
Step 1. Build roaring bitmaps for attribute tags, partitioned into buckets.
INSERT INTO rb_tag
SELECT
    'province',
    province,
    encode_uid / 65536 AS "bucket",
    rb_build_agg(b.encode_uid) AS bitmap
FROM
    dws_userbase a
    JOIN dws_uid_dict b ON a.uid = b.uid
GROUP BY
    province,
    "bucket";

INSERT INTO rb_tag
SELECT
    'gender',
    gender,
    encode_uid / 65536 AS "bucket",
    rb_build_agg(b.encode_uid) AS bitmap
FROM
    dws_userbase a
    JOIN dws_uid_dict b ON a.uid = b.uid
GROUP BY
    gender,
    "bucket";
Step 2. Build BSI data for GMV, partitioned into buckets. Run this step daily to load the previous day's data.
INSERT INTO bsi_gmv
SELECT
    a.category,
    b.encode_uid / 65536 AS "bucket",
    bsi_build(array_agg(b.encode_uid), array_agg(a.gmv)) AS bitmap,
    a.ds
FROM
    usershop_behavior a
    JOIN dws_uid_dict b ON a.uid = b.uid
WHERE
    ds = CURRENT_DATE - interval '1 day'
GROUP BY
    category,
    "bucket",
    ds;
Run profile analysis
All queries below JOIN bsi_gmv and rb_tag on bucket so that the engine processes matching segments together on each node.
Analyze behavior tags for a user group
Query total GMV and average GMV for male users from Guangdong in the 3C category (previous day)
SELECT
    sum(kv[1]) AS total_gmv,          -- Total GMV.
    sum(kv[1])/sum(kv[2]) AS avg_gmv  -- Average GMV.
FROM (
    SELECT
        bsi_sum(t1.gmv_bsi, t2.crowd) AS kv,
        t1.bucket
    FROM
        (SELECT gmv_bsi, bucket FROM bsi_gmv WHERE category = '3C' AND ds = CURRENT_DATE - interval '1 day') t1
    JOIN
        (SELECT rb_and(a.bitmap, b.bitmap) AS crowd, a.bucket FROM
            (SELECT bitmap, bucket FROM rb_tag WHERE tag_name = 'gender' AND tag_val = 'Male ') a  -- Male users.
         JOIN
            (SELECT bitmap, bucket FROM rb_tag WHERE tag_name = 'province' AND tag_val = 'Guangdong') b  -- Users from Guangdong province.
         ON a.bucket = b.bucket
        ) t2
    ON t1.bucket = t2.bucket
    ) t;
Query GMV distribution for male users from Guangdong in the 3C category (previous day)
SELECT
    bsi_stat('{100,300,500}', bsi_add_agg(filter_bsi))
FROM (
    SELECT
        bsi_filter(t1.gmv_bsi, t2.crowd) AS filter_bsi,
        t1.bucket
    FROM
        (SELECT gmv_bsi, bucket FROM bsi_gmv WHERE category = '3C' AND ds = CURRENT_DATE - interval '1 day') t1
    JOIN
        (SELECT rb_and(a.bitmap, b.bitmap) AS crowd, a.bucket FROM
            (SELECT bitmap, bucket FROM rb_tag WHERE tag_name = 'gender' AND tag_val = 'Male ') a  -- Male users.
         JOIN
            (SELECT bitmap, bucket FROM rb_tag WHERE tag_name = 'province' AND tag_val = 'Guangdong') b  -- Users from Guangdong province.
         ON a.bucket = b.bucket
        ) t2
    ON t1.bucket = t2.bucket
    ) t;
Query top 10 GMV values for male users from Guangdong (previous day, all categories)
SELECT
    bsi_topk(bsi_add_agg(filter_bsi), 10)
FROM (
    SELECT
        bsi_filter(t1.gmv_bsi, t2.crowd) AS filter_bsi,
        t1.bucket
    FROM
        (SELECT bsi_add_agg(gmv_bsi) AS gmv_bsi, bucket FROM bsi_gmv WHERE ds = CURRENT_DATE - interval '1 day' GROUP BY bucket) t1
    JOIN
        (SELECT rb_and(a.bitmap, b.bitmap) AS crowd, a.bucket FROM
            (SELECT bitmap, bucket FROM rb_tag WHERE tag_name = 'gender' AND tag_val = 'Male ') a  -- Male users.
         JOIN
            (SELECT bitmap, bucket FROM rb_tag WHERE tag_name = 'province' AND tag_val = 'Guangdong') b  -- Users from Guangdong province.
         ON a.bucket = b.bucket
        ) t2
    ON t1.bucket = t2.bucket
    ) t;
Filter users by behavior tag
Identify users whose GMV exceeds 1,000 in the 3C category over the previous 30 days
SELECT
    rb_to_array(bsi_gt(bsi_add_agg(gmv_bsi), 1000)) AS crowd
FROM
    bsi_gmv
WHERE
    category = '3C'
    AND ds BETWEEN CURRENT_DATE - interval '30 day' AND CURRENT_DATE - interval '1 day';
What's next
BSI functions — Full reference for all BSI functions, including syntax, arguments, and return types.