This topic describes how to connect Hologres with Realtime Compute for Apache Flink to build a real-time data warehouse analytics dashboard.
Prerequisites
-
You have activated Hologres and connected it to a development tool. For more information, see Connect to HoloWeb and run a query.
-
You have activated Realtime Compute for Apache Flink. For more information, see Activate Realtime Compute for Apache Flink.
NoteEnsure that Realtime Compute for Apache Flink and Hologres are in the same region and use the same virtual private cloud (VPC) and vSwitch.
-
You have activated DataV. For more information, see Activate the DataV service.
Background information
Hologres is a real-time interactive analytics product from Alibaba Cloud. It connects directly to Realtime Compute for Apache Flink using the built-in HoloHub API. This connection enables high-concurrency, real-time data writes and queries, delivering responses in seconds.
Hologres is compatible with PostgreSQL, allowing you to connect it directly to business intelligence (BI) tools to analyze and visualize your data.
This topic uses an example of building a real-time operations dashboard for an e-commerce store. The dashboard displays metrics such as total traffic, visits per store, regional sales, and best-selling products.
The following figure shows the end-to-end pipeline for building a real-time operations dashboard with Hologres.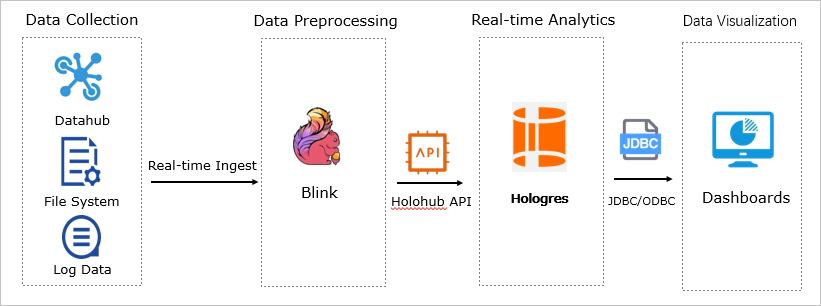
-
Source data is collected and written to Realtime Compute for Apache Flink in real time, where it is cleansed and aggregated.
-
The processed data is then written to Hologres in real time to enable interactive queries.
-
Hologres connects to a DataV dashboard to visualize the real-time operational metrics.
Procedure
-
Obtain the source data.
Obtain source data from DataHub or other service logs.
For demonstration purposes, this tutorial generates data directly from Realtime Compute for Apache Flink. For more information, see Step 3.
-
Create a destination table in Hologres.
Use HoloWeb to create a table for the real-time data. The table schema must match the fields and data types of the source table. For more information, see Connect to HoloWeb and run a query. The following SQL statements provide an example.
BEGIN; CREATE TABLE public.order_details ( "user_id" int8, "user_name" text, "item_id" int8, "item_name" text, "price" numeric(38,2), "province" text, "city" text, "ip" text, "longitude" text, "latitude" text, "sale_timestamp" timestamptz NOT NULL ); CALL SET_TABLE_PROPERTY('public.order_details','orientation', 'column'); CALL SET_TABLE_PROPERTY('public.order_details','clustering_key', 'sale_timestamp:asc'); CALL SET_TABLE_PROPERTY('public.order_details','segment_key', 'sale_timestamp'); CALL SET_TABLE_PROPERTY('public.order_details','bitmap_columns', 'user_name,item_name,province,city,ip,longitude,latitude'); CALL SET_TABLE_PROPERTY('public.order_details','dictionary_encoding_columns','user_name:auto,item_name:auto,province:auto,city:auto,ip:auto,longitude:auto,latitude:auto'); CALL SET_TABLE_PROPERTY('public.order_details','time_to_live_in_seconds', '3153600000'); CALL SET_TABLE_PROPERTY('public.order_details','distribution_key', 'user_id'); CALL SET_TABLE_PROPERTY('public.order_details','storage_format', 'orc'); COMMIT; -
In the Realtime Compute for Apache Flink console, upload the custom connector JAR resource ordergen. For more information, see Upload and use a custom connector.
-
Cleanse the data using Realtime Compute for Apache Flink.
In the Realtime Compute for Apache Flink console, create a job to cleanse and aggregate the source data. The job then uses the HoloHub API to write the data to Hologres in real time. For more information, see Job development overview. The following SQL statements provide an example.
CREATE TEMPORARY TABLE source_table (
user_id BIGINT,
user_name VARCHAR,
item_id BIGINT,
item_name VARCHAR,
price numeric (38, 2),
province VARCHAR,
city VARCHAR,
longitude VARCHAR,
latitude VARCHAR,
ip VARCHAR,
sale_timestamp TIMESTAMP
 )
WITH ('connector' = 'ordergen');

CREATE TEMPORARY TABLE hologres_sink (
user_id BIGINT,
user_name VARCHAR,
item_id BIGINT,
item_name VARCHAR,
price numeric (38, 2),
province VARCHAR,
city VARCHAR,
longitude VARCHAR,
latitude VARCHAR,
ip VARCHAR,
sale_timestamp TIMESTAMP
 )
WITH (
'connector' = 'hologres',
'dbname' = '<holo_db>',
'tablename' = '<receive_table>',
'username' = '<uid>',
'password' = '<pid>',
'endpoint' = '<host>'
 );

INSERT INTO hologres_sink
SELECT user_id,
 user_name,
 item_id,
 item_name,
 price,
 province,
 city,
 longitude,
 latitude,
 ip,
 sale_timestamp
FROM
source_table;
The following table describes the parameters.
Parameter
Description
holo_db
The name of the Hologres database.
receive_table
The name of the destination table in Hologres. In this tutorial, this is
public.order_details.uid
The AccessKey ID of your Alibaba Cloud account.
pid
The AccessKey secret of your Alibaba Cloud account.
host
The domain name for the VPC endpoint of the Hologres instance. Find this domain name in the Network Information section on the Instance Details page of the Hologres console.
-
On the Deployments page of the Realtime Compute for Apache Flink console, start the job and wait for its status to become Running. For more information, see Start a job.
-
Query the data in real time in Hologres.
Run queries in Hologres to analyze the real-time data from different dimensions. The following SQL statements are examples.
SELECT SUM(price) AS "GMV" FROM order_details ; SELECT COUNT(DISTINCT user_id) AS "UV" FROM order_details ; SELECT city AS "City", COUNT(DISTINCT user_id) AS "CustomerCount" FROM order_details GROUP BY "City" ORDER BY "CustomerCount" DESC limit 100; SELECT item_name AS "Product", SUM(price) AS "SalesAmount" FROM order_details GROUP BY "Product" ORDER BY "SalesAmount" DESC limit 100; SELECT to_char(sale_timestamp, 'MM-DD') AS "Date", SUM(price) AS "GMV" FROM order_details GROUP BY "Date" ORDER BY "GMV" DESC limit 100; -
Display the real-time DataV dashboard.
Create a real-time dashboard by connecting the Hologres query results directly to DataV. Follow these steps:
-
Add a data source.
-
In the DataV console, navigate to in the left-side navigation pane. On the Data Source page, click Add Source.
-
In the Add Data Source panel, configure the parameters for the Hologres data source.
-
Click OK.
-
-
Create the real-time dashboard.
Select the components you need for your dashboard and configure their data sources. For more information, see Overview.
This tutorial uses a basic column chart, carousel, basic flat map, and ticker board. The following steps use the ticker board as an example.
-
Configure the data source.
-
Configure the border, font, and color for the ticker board. The component preview shows a real-time display of the border decorations, title text, and numeric values.
-
-
Display the real-time dashboard.
After configuring the dashboard components and data sources, you can add decorative elements to customize the appearance.
-
The left side displays product visits and city sales amounts in real time.
-
The map in the middle displays the location of each order, the total sales amount, and the total visits in real time.
-
The right side displays the sales share and sales ranking of products in real time.
-
-