Set up alert rules in Grafana to monitor key service metrics. When a metric crosses a threshold, Grafana alerts your team so you can promptly detect and resolve issues, preventing service interruptions.
For versions 8.2.x and earlier
Step 1: Log in to Grafana
-
Log on to the Managed Service for Grafana console. In the left-side navigation pane, click Workspace Management.
-
On the Workspace Management page, find the workspace that you want to manage and click the URL in the URL column to go to Grafana.
NoteYou can log on to Grafana with the administrator account of Grafana and the password that you configured when you created the workspace. You can also click Sign in with Alibaba Cloud to log on to Grafana with the current Alibaba Cloud account.
Step 2: Create a notification channel
In the left navigation bar, click the ![]() icon, select Notification channels, and then click New channel to create a notification channel.
icon, select Notification channels, and then click New channel to create a notification channel.
Parameter | Description |
Name | A custom name for the channel. |
Type | The notification method, such as DingTalk, Webhook, or Email. |
Addresses | The destination address for notifications. For this example, use a DingTalk chatbot webhook URL. For more information about how to obtain a DingTalk chatbot webhook URL, see Obtain the webhook URL of a DingTalk chatbot. |
Step 3: Create an alert rule
In the left navigation bar, select
 > Dashboard, and click Add an empty panel.
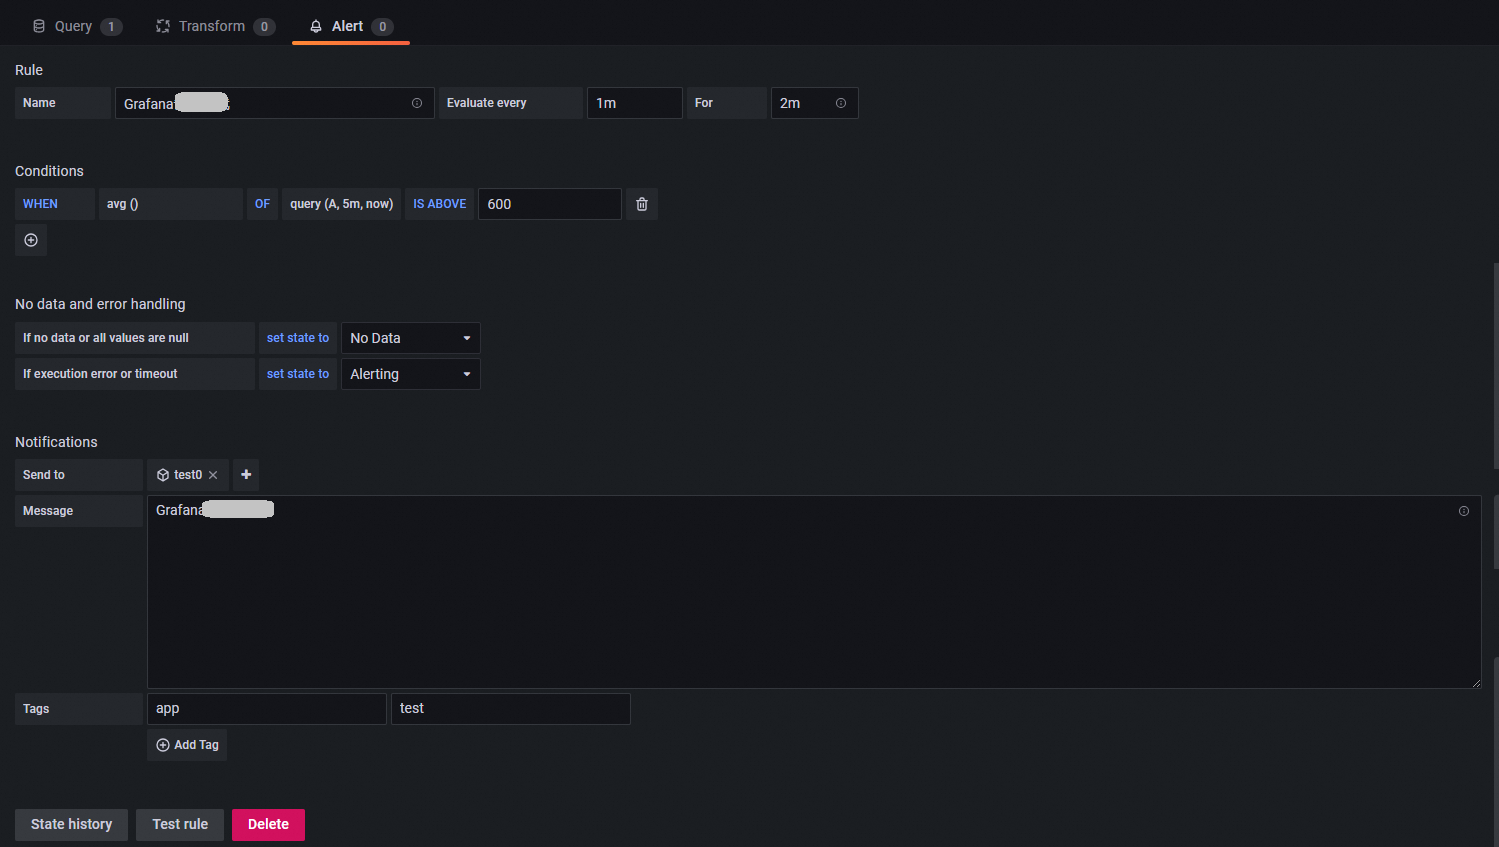
On the Query tab, select a data source and configure a query statement. Then, on the Alert tab, click Create Alert to configure an alert rule.
Parameter
Description
Rule
Name: The name of the alert rule.
Evaluate Every: How often the alert is evaluated. Valid values:
1m,2m, and5m.For: The duration for which an alert condition must be continuously met before an alert is sent to the notification channel.
Conditions
The conditions that trigger the alert. In this example, an alert is triggered when the average value (
avg()) of query A exceeds 600.No data and error handling
Defines how the alert behaves when a query returns no data or times out.
Notifications
Send to: The notification channel to which you want to send notifications. In this example, this is the DingTalk channel that you created in Step 2: Create a notification channel.
Message: The content of the alert message. For more information about the supported expressions, see Message templating.
Tags: Customizable tags.
(Optional) Step 4: View alert rules
In the left navigation bar, select ![]() > Alert Rules. On the Alert Rules tab, you can view the list of alert rules.
> Alert Rules. On the Alert Rules tab, you can view the list of alert rules.
For versions later than 8.2.x
The UI may differ slightly between Grafana 9.0.x and 10.0.x, but the process is the same. This section uses Grafana 9.0.x as an example. You can also create an alert rule from a panel, as described in Step 3: Create an alert rule.
Step 1: Disable the integrated ARMS alerting plug-in
-
Log on to the Managed Service for Grafana console. In the left-side navigation pane, click Workspace Management.
-
On the Workspace Management page, click the ID of the workspace that you want to manage.
In the left navigation bar, click Alert Management, disable the integrated ARMS alert plugin, and enable Grafana native alerting.
Step 2: Create an alert rule
-
On the Workspace Management page, find the workspace that you want to manage and click the URL in the URL column to go to Grafana.
NoteYou can log on to Grafana with the administrator account of Grafana and the password that you configured when you created the workspace. You can also click Sign in with Alibaba Cloud to log on to Grafana with the current Alibaba Cloud account.
In the left navigation bar, select
 > Alert rules, and then click New alert rule or Create alert rule.
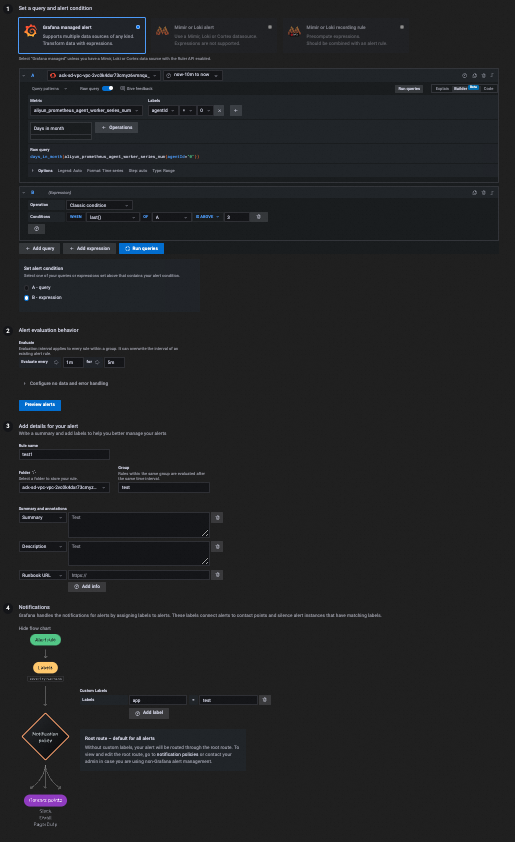
On the Create alert rule page, configure the alert rule, and click Save.
Parameter
Description
Set a query and alert condition
Configure the data source query and the condition that triggers the alert.
Query patterns: The query statements.
Operation: The alert expression type. Classic condition is compatible with alert rules created in versions earlier than 8.2.x.
Conditions: The conditions that trigger an alert. In this example, an alert is triggered when the average value (
avg()) of query A exceeds 600.
Alert evaluation behavior
Set the evaluation interval and alert behavior.
Evaluate Every: How often the alert is checked. Valid values:
1m,2m, and5m.For: The duration for which an alert condition must be continuously met before an alert is sent to the notification channel.
Configure no data and error handling: Whether to send an alert when no data is returned or a query times out.
Add details for your alert
Specify the alert rule name, folder, group, and annotations.
Rule Name: The name of the alert rule.
Folder: The folder that contains the alert.
Group: The group to which the alert belongs. Alerts in the same group are processed at the same interval.
Summary and annotations: The alert content, associated dashboard, and folder.
Notifications
Configure Custom Labels: Labels used to match notification policies.
On the Alert rules page, view alerts.
Step 3: Create a contact point
In the left navigation bar, select
> Contact points.On the Contact Points tab, click New Contact Point or Add Contact Point.
On the New contact point page, configure the following parameters.
Parameter
Description
Name
A name for the contact point.
Contact point type
The notification method, such as DingTalk, Webhook, or Email.
Addresses
The destination address for notifications. For this example, use a DingTalk chatbot webhook URL. For more information about how to obtain a DingTalk chatbot webhook URL, see Obtain the webhook URL of a DingTalk chatbot.
Step 4: Create a notification policy
Notification policies associate alert rules with contact points.
In the left navigation bar, select
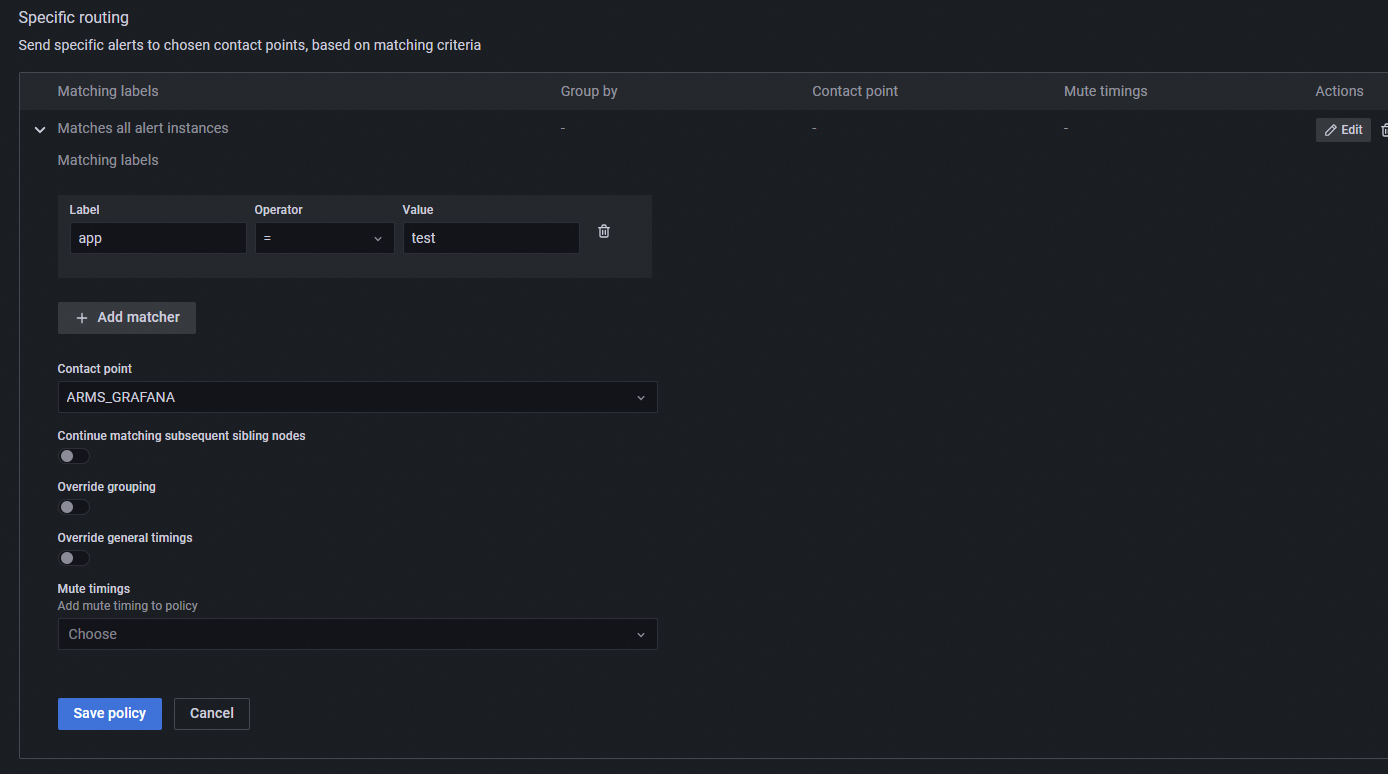
> Notification policies.On the Notification policies tab, click New nested policy or New specific policy. Configure the following parameters to receive alerts from native Grafana alerting.
Parameter
Description
Matching labels
Labels that determine which alert rules the policy applies to.
Contact point
The contact point where matching alerts are sent.
The other parameters configure alert grouping and muting.