Alibaba Cloud Managed Service for Grafana integrates with Alibaba Cloud Elasticsearch through a built-in plugin. Connect your Elasticsearch cluster to Grafana using the cluster's public endpoint, then build dashboards to visualize your data in real time.
Background information
Alibaba Cloud Elasticsearch is a fully managed, out-of-the-box cloud service developed based on open source Elasticsearch. It is compatible with open source features and supports the pay-as-you-go billing method. In addition to built-in components such as Elasticsearch, Logstash, Kibana, and Beats, Alibaba Cloud Elasticsearch provides the free X-Pack plugin together with Elastic. Widely used in real-time log analysis and processing, information retrieval, and multidimensional data query and analysis, Alibaba Cloud Elasticsearch integrates advanced capabilities such as security, SQL, machine learning, alerting, and monitoring. For more information, see What is Alibaba Cloud Elasticsearch?
Prerequisites
Before you begin, make sure that you have:
A Managed Service for Grafana workspace
An Alibaba Cloud Elasticsearch cluster with Public Network Address turned on
The public endpoint of the Elasticsearch cluster (available on the Basic Information page in the Elasticsearch console)
The username and password for the Elasticsearch cluster (default username:
elastic)The IP address of your Grafana workspace (available on the Workspace Information page in the Managed Service for Grafana console)
The name of the Elasticsearch index to query and its time field
Step 1: Add the Grafana workspace IP to the Elasticsearch whitelist
Add the Grafana workspace IP address to the Elasticsearch cluster's public IP whitelist so that Grafana can connect to the cluster.
Log on to the Alibaba Cloud Elasticsearch console.
In the left-side navigation pane, choose Elastic Stack Cloud Native PaaS > Elasticsearch Clusters.
In the top navigation bar, select the resource group and region of the target cluster, then click the cluster ID.
In the left-side navigation pane, choose Configuration and Management > Security.
In the Network Settings section, click Modify next to Public IP Address Whitelist.
NotePublic Network Address must be turned on before you can modify the whitelist. By default, this switch is turned off.
Click Configure next to the default whitelist.
In the Modify IP Address Whitelist dialog box, enter the IP address of your Grafana workspace in the IP Addresses in Whitelist field.
NoteTo find the Grafana workspace IP address, go to the Workspace Information page in the Managed Service for Grafana console. For more information, see View or modify workspace information.
Click OK.
Step 2: Log on to Grafana
Log on to the Managed Service for Grafana console. In the left-side navigation pane, click Workspace Management.
Find your workspace and click the link in the URL column to open Grafana.
NoteLog on with the Grafana administrator account and the password you set when creating the workspace. Alternatively, click Sign in with Alibaba Cloud to use your current Alibaba Cloud account.
Step 3: Add the data source
Open the data source configuration page in Grafana:
Grafana 9.0.x: In the left-side navigation pane, choose
 > Data sources, then click Add data source.
Grafana 10.0.x: Click
 on the homepage, then choose Management > Data sources and click + Add new data source.
Search for and select Elasticsearch, then configure the following settings on the Settings tab:
| Section | Parameter | Description | Example |
|---|---|---|---|
| Name | A custom name for the data source. | Elasticsearch data source | |
| HTTP | URL | The public endpoint of the Elasticsearch cluster. Format: http://<Elasticsearch-endpoint>:9200. | http://es-cn-xxxxxxxxx.public.elasticsearch.aliyuncs.com:9200 |
| Auth | Basic auth | Turn on this toggle, then configure the credentials in Basic Auth Details. | N/A |
| Basic Auth Details | User | The username for the Elasticsearch cluster. | elastic |
| Password | The password for the Elasticsearch cluster. | N/A | |
| Elasticsearch details | Index name | The index to query. If you have not created an index, you can temporarily use the Elasticsearch self-monitoring index (.monitoring-es-7-2022.01.11) to verify connectivity. Replace 2022.01.11 with a date within the previous two days. Make sure that the date is later than the date when the Elasticsearch cluster was created. | .monitoring-es-7-2022.01.11 |
| Time field name | The timestamp field in the index. If you use the self-monitoring index, set this to timestamp. | timestamp | |
| ElasticSearch version | *(Grafana 9.0.x only)* The version of the Elasticsearch cluster, available on the Basic Information page. | 7.10+ |
Find the public endpoint on the Basic Information page in the Elasticsearch console. For details, see View the basic information of a cluster.
To use HTTPS, enable it in the Elasticsearch console first, then use the format https://<Elasticsearch-endpoint>:9200.
If you forget the cluster password, reset it: go to the cluster details page, choose Configuration and Management > Security, and click Reset Password in the Access Settings section.
For more information, see Grafana Elasticsearch data source documentation.
Click Save & test.
Grafana 9.0.x: The message
Index OK. Time field name OKconfirms a successful connection.Grafana 10.0.x: The message
Data source is workingconfirms a successful connection.
Step 4: Create a dashboard panel
Create a dashboard:
Grafana 9.0.x: In the left-side navigation pane, choose
 > New dashboard, then click Add a new panel.
Grafana 10.0.x: Click
, choose Dashboards, select New dashboard from the New drop-down list, then click + Add visualization.
On the Query tab (Grafana 9.0.x) or in the Select data source dialog box (Grafana 10.0.x), select the Elasticsearch data source you added in Step 3.
Configure the query. For example, to view a log list with details, set Metric to Logs and select Logs from the Visualizations drop-down list in the upper-right corner.
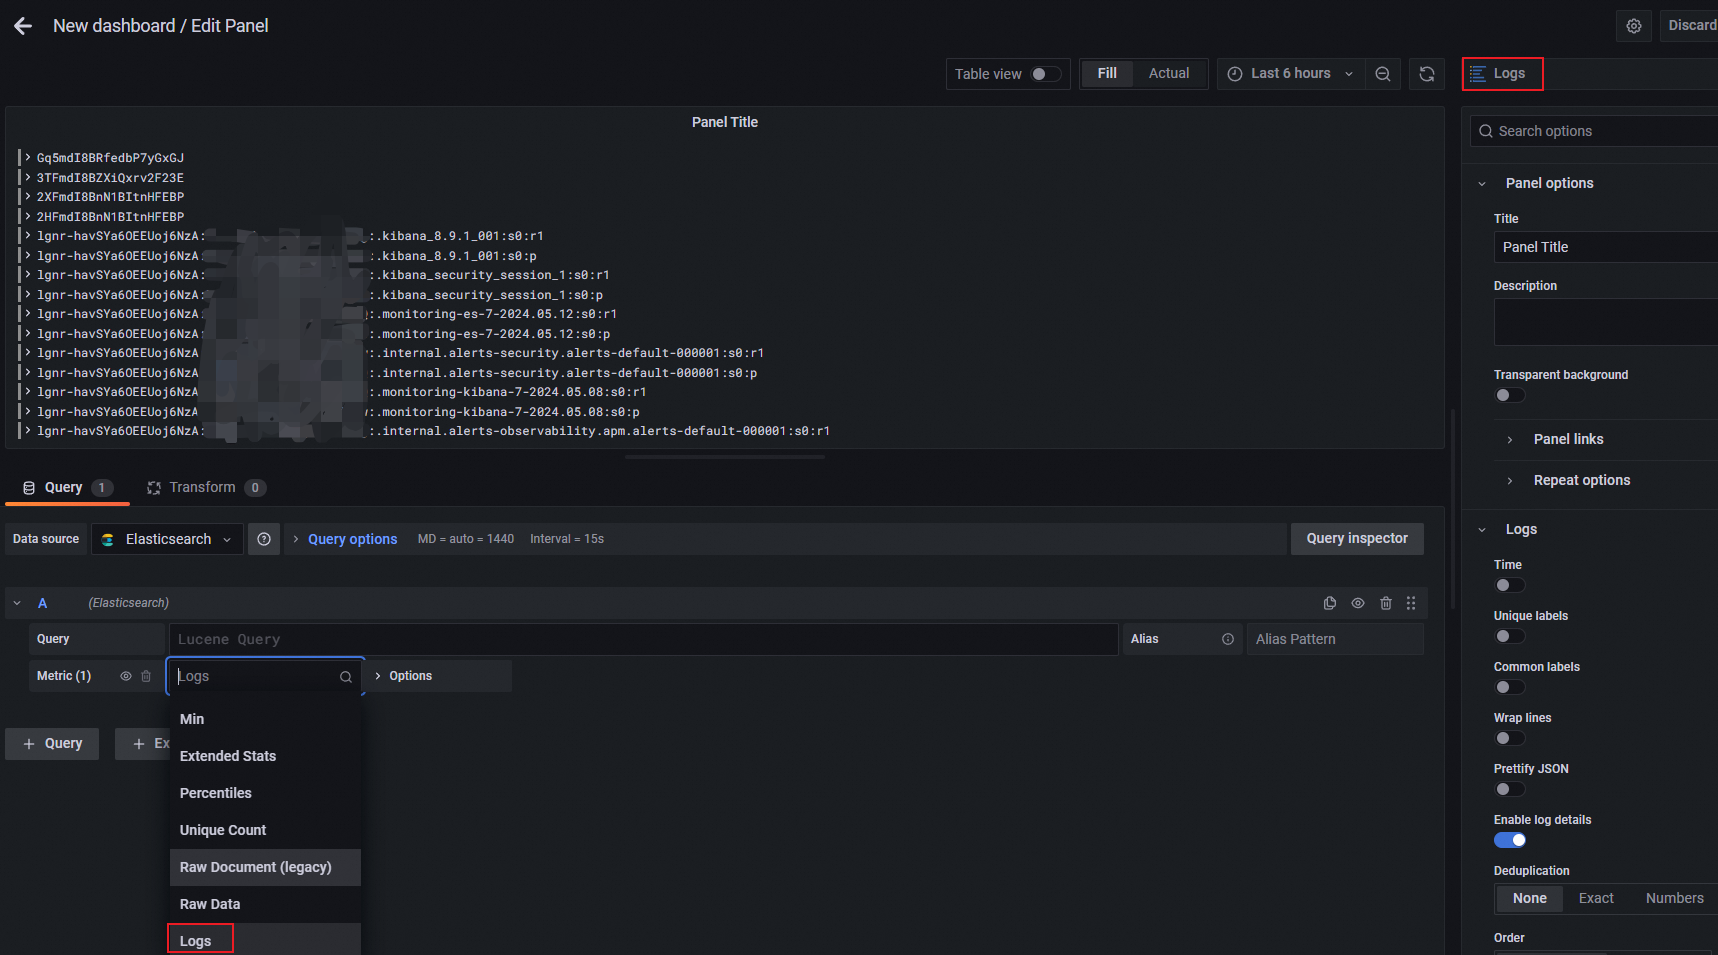
Click Apply.
Click the
 icon in the upper-right corner, specify a dashboard name and folder, then click Save.
Step 5: View monitoring data
Navigate to the dashboard you saved:
Grafana 9.0.x: In the left-side navigation pane, choose
> Browse. Find your folder and click the dashboard.Grafana 10.0.x: Click
, then click Dashboards. Find your folder and click the dashboard.
What's next
Grafana Elasticsearch data source documentation -- Explore advanced query features, template variables, and alerting for Elasticsearch data sources.
View the basic information of a cluster -- Find endpoint URLs, version numbers, and other cluster details.