If you use Zabbix for infrastructure monitoring and want to build unified dashboards in Grafana, the Zabbix plug-in connects Managed Service for Grafana directly to your Zabbix server.
Prerequisites
Before you begin, make sure that you have:
A Grafana workspace running version 9.0.x or later. For more information, see Create and manage a Grafana workspace
A Zabbix server that is deployed and collecting data
The Zabbix JSON-RPC API endpoint URL (typically
https://[Zabbix Server IP]/api_jsonrpc.php)A Zabbix account with API access. For production environments, create a dedicated API user with minimum required permissions instead of using the default administrator account
Step 1: Open the Grafana console
-
Log on to the Managed Service for Grafana console. In the left-side navigation pane, click Workspace Management.
-
On the Workspace Management page, find the workspace that you want to manage and click the URL in the URL column to go to Grafana.
NoteYou can log on to Grafana with the administrator account of Grafana and the password that you configured when you created the workspace. You can also click Sign in with Alibaba Cloud to log on to Grafana with the current Alibaba Cloud account.
Step 2: Install and enable the Zabbix plug-in
Open the plug-in management page:
Grafana 9.0.x: In the left-side navigation pane, click the
 icon, then click the Plugins tab on the Configuration page.
Grafana 10.0.x: Click the
 icon in the upper-left corner, then go to Administration > Plugins.
Search for Zabbix and click it.
Click Install.
After installation completes, click Enable.
The plug-in is disabled by default after installation. Enable it before you proceed.
Step 3: Add a Zabbix data source
Open the data source configuration page:
Grafana 9.0.x: In the left-side navigation pane, click the
 icon, then click Add data source on the Data sources tab.
Grafana 10.0.x: Click the
icon, then go to Connections > Data sources and click Add new data source.
Search for Zabbix and click it.
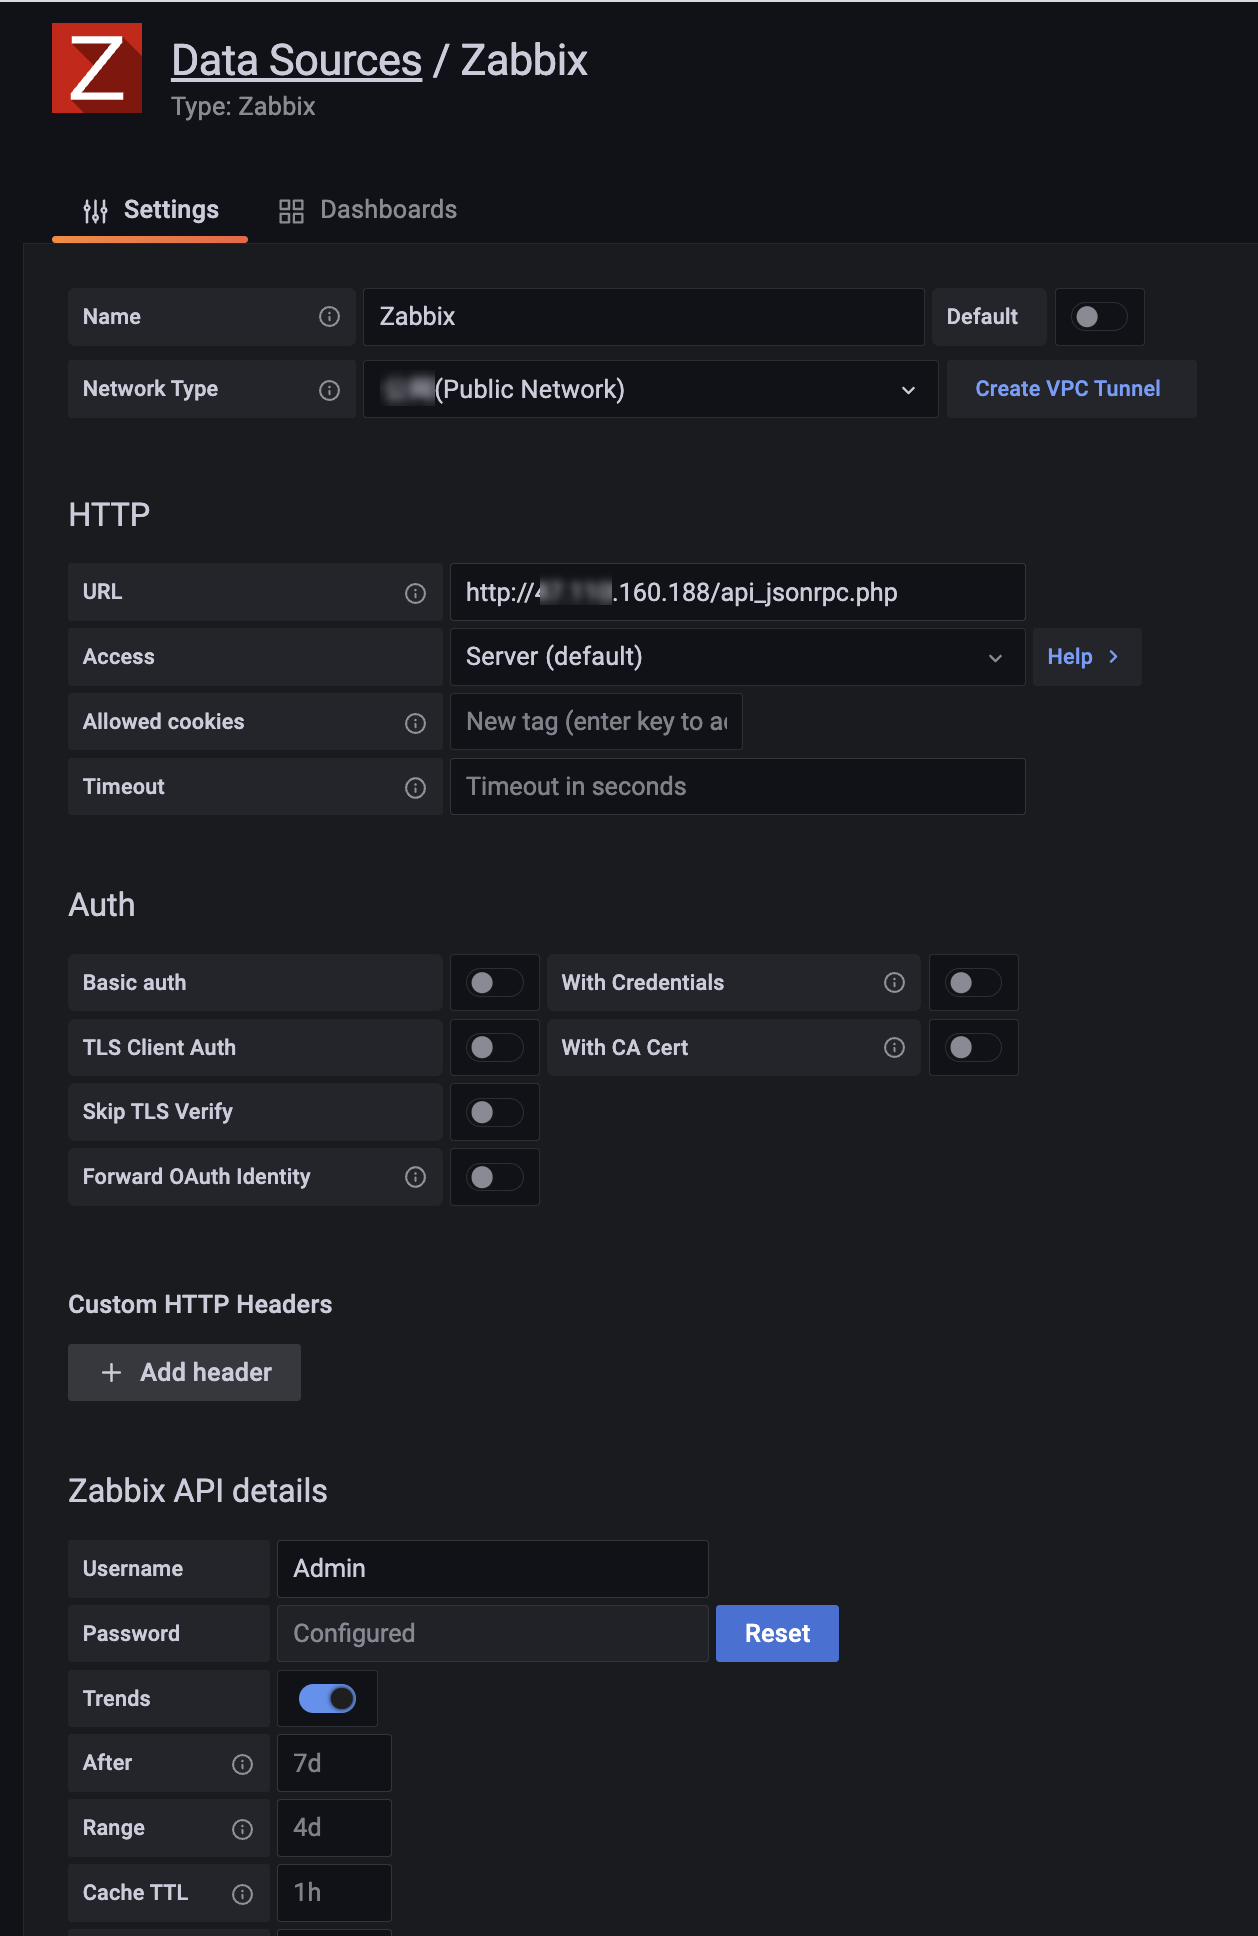
On the Settings tab, configure the following parameters:
Grafana 9.0.x
Grafana 10.0.x

Parameter
Description
Example
Name
A display name for this data source.
Zabbix
URL
The Zabbix JSON-RPC API endpoint.
https://[Zabbix Server IP]/api_jsonrpc.phpUsername
The username that is used to log on to Zabbix.
Default value: Admin.
Password
The password that is used to log on to Zabbix.
Default value: zabbix.
NoteThe default Zabbix credentials are
Admin/zabbix. For production environments, create a dedicated API user with only the permissions your dashboards require, rather than using the default administrator account.Click Save & test. A success message confirms that Grafana can reach the Zabbix API.
Step 4: Create a dashboard with Zabbix data
Open the dashboard creation page:
Grafana 9.0.x: In the left-side navigation pane, click the
 icon. On the Dashboards page, click the Browse tab, then click New Dashboard.
Grafana 10.0.x: Click the
icon, click Dashboards, then click New > New Dashboard.
Add a panel:
Grafana 9.0.x: Click Add a new panel.
Grafana 10.0.x: Click + Add visualization, then select your Zabbix data source in the Select data source dialog box.
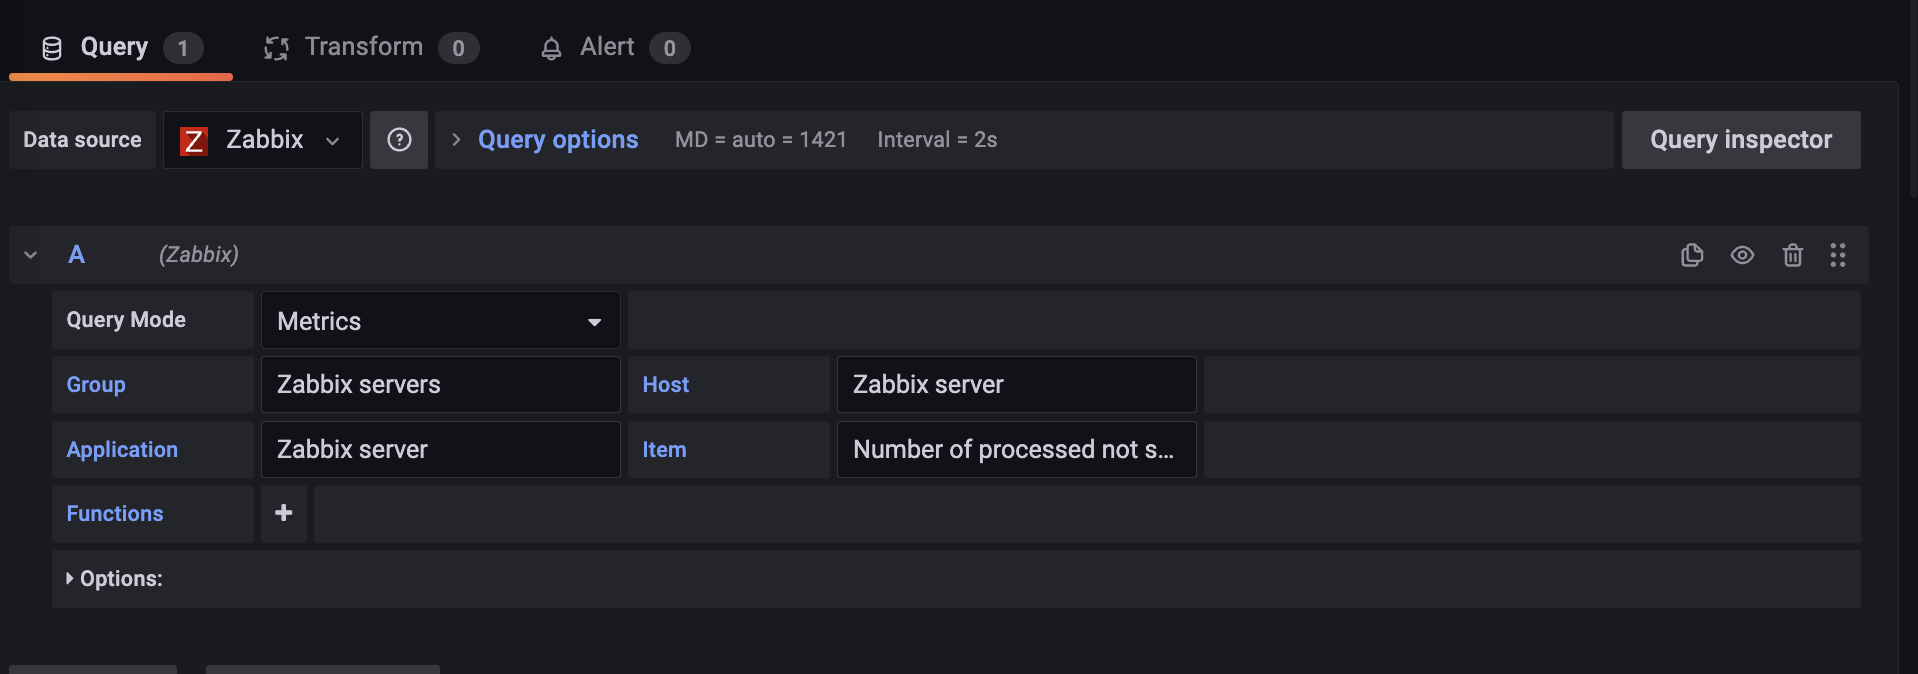
On the Query tab, select your Zabbix data source (if not already selected) and configure the query in the A section. For example, select a host group, host, application, and item to display CPU utilization or memory usage.
Grafana 9.0.x
Grafana 10.0.x

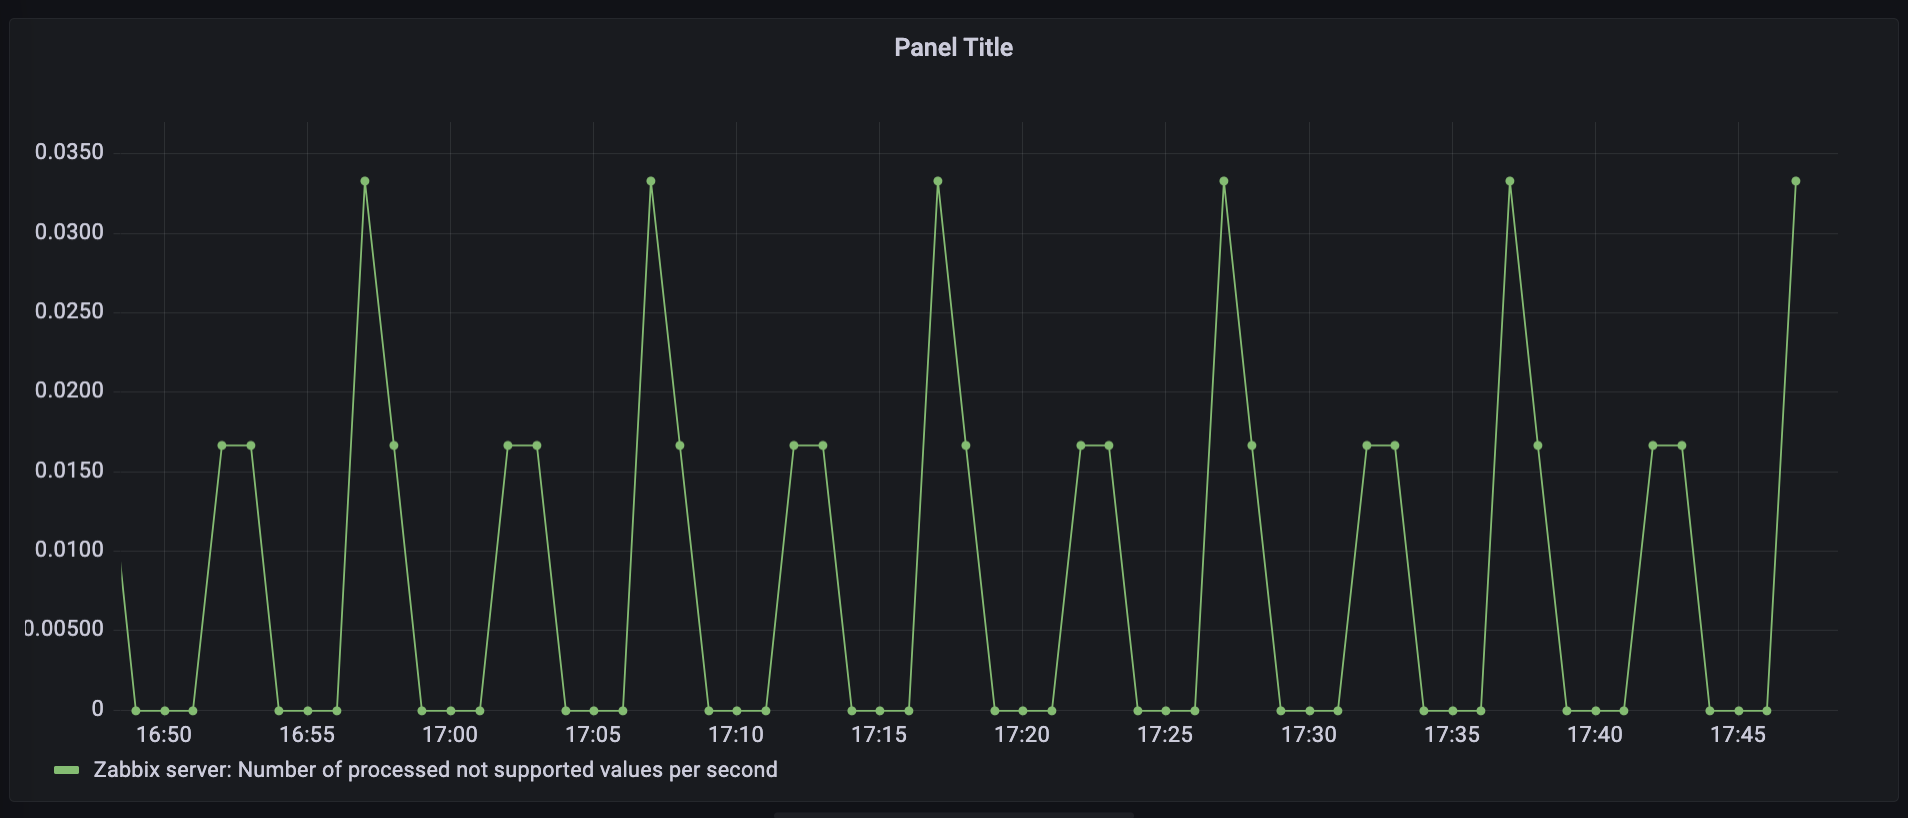
In the right-side pane, set the panel title, visualization type, and graph styles.
Click Apply in the upper-right corner to add the panel to the dashboard.
Click the
 icon in the upper-right corner, enter a dashboard name, select a folder, and click Save.