Grafana is an open source observability platform for visualizing data from multiple sources. You can use a Grafana account to manage all data that you want to monitor. This topic describes how to integrate the data of Elastic Compute Service (ECS) instances within multiple Alibaba Cloud accounts into a workspace in Managed Service for Grafana.
Background information
If you have multiple Alibaba Cloud accounts and you want to monitor the cloud services, such as ECS, within these accounts, you can use Grafana to integrate all cloud service data into a Grafana workspace.
Example
This topic provides an example of how to integrate all ECS data within Alibaba Cloud accounts A and B into a workspace in Grafana V9.0.x or V10.x within account A.
Step 1: Integrate the ECS data of account A and generate a dashboard
Use account A to log on to the Alibaba Cloud Management Console and integrate the ECS data into a workspace in Managed Service for Grafana.
Log on to the Managed Service for Grafana console. In the left-side navigation pane, click Workspace Management.
On the Workspace Management page, click the ID of the workspace that you want to manage.
On the Workspace Information page, click Prometheus Service (Old) in the left part of the Cloud Service Integration section.
In the right part of the page, find the data source to be integrated and click Integrations in the Actions column. In the dialog box that appears, click OK.
NoteYou can click Configure Cloud Service Monitoring to connect more cloud services to Managed Service for Prometheus for monitoring.
After the integration is complete, Integrated is displayed in the Status column of the data source.
Click Folder in the Actions column of the data source. On the Dashboards page of Grafana, you can view the folder in which the dashboards of the data source are stored.
Click the folder to view the dashboards.
Step 2: Connect ECS to the cloud service environment
Integrate the ECS data of Alibaba Cloud account B into Managed Service for Prometheus. Then, use Managed Service for Prometheus to add the ECS data source to the Grafana workspace within account A.
Use account B to log on to the Application Real-Time Monitoring Service (ARMS) console.
On the Overview page, click Connect to other components in the Integration Center section. You can also click Integration Center in the left-side navigation pane.
In the Infrastructure section of the Integration Center page, click Alibaba Cloud ECS.
In the panel that appears, select a region to store the data and click OK.
After the integration is complete, click Integration Management.
NoteIf the ECS instances within the current account are connected to Managed Service for Prometheus, you can perform the following steps to view the connected ECS instances: Log on to the ARMS console. In the left-side navigation pane, choose . On the Instances page, click the names of the instances whose Instance Type is Prometheus Instance for Cloud Services.
Step 3: Obtain the HTTP API endpoint
In the left-side navigation pane, click Integration Management.
On the Integrated Environments tab of the Integration Management page, click Cloud Service Region.
On the Cloud Service Region tab, click the name of the environment instance that you want to manage.
On the Component Management tab, click the name of Default Metric Storage.

On the Settings tab, copy and save the public endpoint in the HTTP API URL (Grafana Read URL) section.
NoteThe internal endpoint cannot be used because the ECS instances of accounts A and B use different virtual private clouds (VPCs).
Step 4: Configure a data source in Grafana
Grafana V9.x
Use account A to log on to the Managed Service for Grafana console. In the left-side navigation pane, click Workspace Management.
On the Workspace Management page, find the workspace that you want to manage and click the URL in the URL column to go to Grafana.
NoteYou can log on to a Grafana workspace by using the administrator account of Grafana and the password that you configured when you created the workspace. You can also click Sign in with Alibaba Cloud to log on to the Grafana workspace that is purchased with your Alibaba Cloud account.
In the left-side navigation pane of Grafana, choose
 > Data sources.
 On the Data Sources tab, click Add data source.
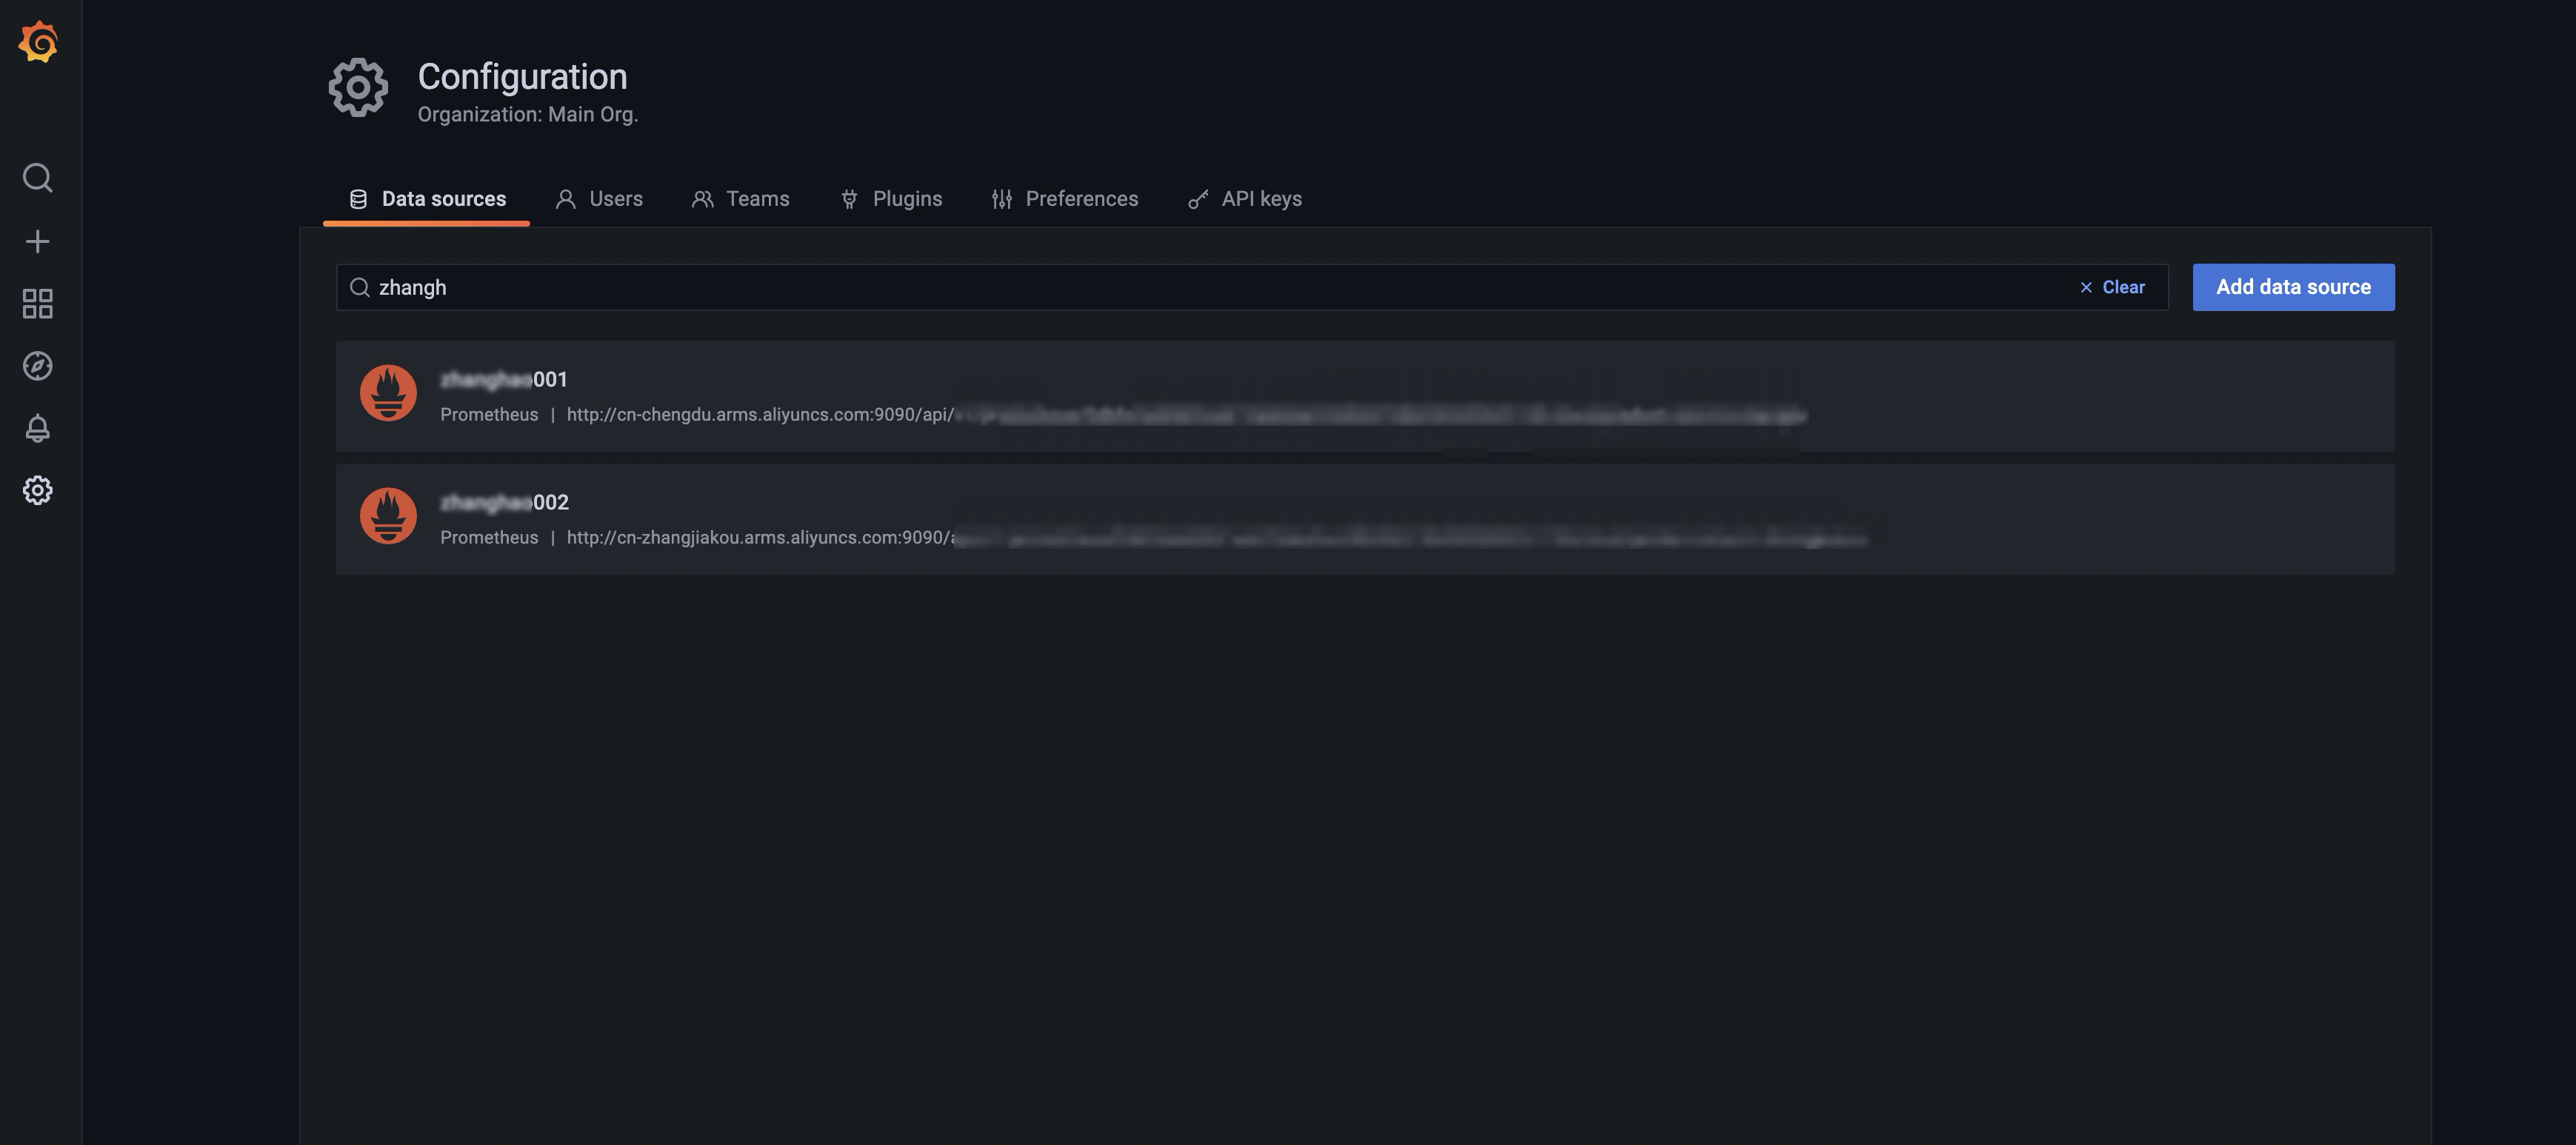
On the Add data source page, click Prometheus.
On the Settings page, set Name to the name of the ECS data source and enter the HTTP API endpoint that you obtained in Step 3 in the URL field of the HTTP section.
Click Save & test.
If
Data source is workingappears, the ECS data source has been added to Grafana. For more information, see Grafana documentation.
Grafana V10.x
Use account A to log on to the Managed Service for Grafana console. In the left-side navigation pane, click Workspace Management.
On the Workspace Management page, find the workspace that you want to manage and click the URL in the URL column to go to Grafana.
NoteYou can log on to a Grafana workspace by using the administrator account of Grafana and the password that you configured when you created the workspace. You can also click Sign in with Alibaba Cloud to log on to the Grafana workspace that is purchased with your Alibaba Cloud account.
After you log on to the Grafana system, click the
 icon in the upper-left corner.
 In the left-side navigation pane, choose Administration > Data sources.
On the Data sources page, click Add data source.
On the Add data source page, click Prometheus.
On the Settings page, set Name to the name of the ECS data source and enter the HTTP API endpoint that you obtained in Step 3 in the URL field of the HTTP section.
Click Save & test.
If
Data source is workingappears, the ECS data source has been added to Grafana. For more information, see Grafana documentation.
Step 5: Create a Grafana dashboard for the ECS data of account B
You can use the ECS dashboard template of account A to create a Grafana dashboard for the ECS data source of account B.
Grafana V9.x
In the left-side navigation pane, move the pointer over the
 icon and click Browse.
 Click the name of the dashboard created in Step 4.
In the upper part of the page, move the pointer over the
 icon and click Export.
 On the Export tab, turn on the Export for sharing externally switch and click Save to file. This way, the dashboard is exported as a JSON file.

In the left-side navigation pane, move the pointer over the
 icon and click Import.
 On the Import page, click Upload JSON file to upload the JSON file that you exported in step 4.
Modify the dashboard information in the Options section. The following table describes the parameters.
Parameter
Description
Name
The dashboard name. You can specify a custom name.
Folder
The folder in which the dashboard is stored.
Unique identifier (UID)
The dashboard UID. You can click Change uid to change the dashboard UID. Make sure that the string you enter is unique.
Select a Prometheus data source
The drop-down list from which you can select a Prometheus data source. Select the data source that is integrated into Grafana in Step 4.

After the configurations are complete, click Import and wait for a few seconds to view the dashboard.
Grafana V10.x
After you log on to the Grafana system, click the
icon in the upper-left corner. In the left-side navigation pane, click Dashboards.
On the Dashboards page, click the name of the dashboard that you created in Step 4.
In the upper part of the page, move the pointer over the
icon and click Export. On the Export tab, turn on the Export for sharing externally switch and click Save to file. This way, the dashboard is exported as a JSON file.

In the left-side navigation pane, click Dashboards.
On the Dashboards page, click New and choose Import from the drop-down list.
On the Import dashboard page, click the
 icon to upload the JSON file that you exported in step 5.
 Modify the dashboard information in the Options section. The following table describes the parameters.
Parameter
Description
Name
The dashboard name. You can specify a custom name.
Folder
The folder in which the dashboard is stored.
Unique identifier (UID)
The dashboard UID. You can click Change uid to change the dashboard UID. Make sure that the string you enter is unique.

After the configurations are complete, click Import and wait for a few seconds to view the dashboard.
Advanced operations
In the preceding steps, you can only integrate the data of multiple Alibaba Cloud accounts into the same Grafana workspace. However, you still need to view the dashboards of different accounts separately. The following steps demonstrate how to integrate all data in a single dashboard.
Grafana V9.x
Integrate the cloud service data of all accounts into Grafana and create a dashboard for one of the data sources. For more information, see Step 4.
ImportantWe recommend that you use a consistent file naming convention so that you can use regular expressions to filter data sources.
In the left-side navigation pane, click the
 icon. Then, click the name of the data dashboard that you created.
 On the Dashboards page, click the
 icon in the upper-right corner.
In the left-side navigation pane, click Variables. Then, click Add variable.
On the Edit page, configure the parameters and click Update. The following table describes the parameters.
Section
Parameter
Description
General
Name
The variable name. You can specify a custom name.
Type
The variable type. Select Data source.
Data source options
Type
The data source type. Select Prometheus.
Instance name filter
The conditions used to filter dashboards. Enter regular expressions to filter the dashboards. Format:
/.*-(.*)-.*/.
Update the data sources of all relevant variables and panels to the new data source added in the previous step.
Modify a variable.
On the Variables page, click New.
In the General section of the Edit page, change the value of Type to Query.
In the Query Options section, change the value of Data source to the variable name that you specified in the previous step, such as
${query0}.Click Update.
Modify a panel.
Return to the Dashboards page, click the name of the panel for which you want to modify the data source, and then click Edit from the drop-down list.

On the Query tab of the Edit Panel page, select the variable name that you specified in the previous step from the Data source drop-down list, such as
${query0}.
In the upper-right corner of the page, click Apply.
In the upper-right corner of the Dashboards page, click the
 icon. In the left-side navigation pane, click JSON Model.
 On the JSON Model page, replace
datasourcein the code with the variable name that you specified in the previous step.Example: "datasource": { "type": "Prometheus", "uid": "${query0}" },Click Save changes.
After the modifications take effect, you can view the dashboards of different data sources by switching data sources on the Dashboards page.

Grafana V10.x
Integrate the cloud service data of all accounts into Grafana and create a dashboard for one of the data sources. For more information, see Step 4.
ImportantWe recommend that you use a consistent file naming convention so that you can use regular expressions to filter data sources.
In the left-side navigation pane, click Dashboards. Then, click the name of the dashboard that you created.
On the Dashboards page, click the
icon in the upper-right corner. In the left-side navigation pane, click Variables. Then, click Add variable.
On the page that appears, configure the parameters and click Apply. The following table describes the parameters:
Parameter
Description
Select variable type
The variable type. Select Data source from the drop-down list.
Name
The variable name. You can specify a custom name.
Show on dashboard
The way to show metrics on the dashboard. Select Label and value.
Type
The data source type. Select Prometheus from the drop-down list.
Instance name filter
The conditions used to filter dashboards. Enter regular expressions to filter the dashboards. Format:
/.*-(.*)-.*/.Update the data sources of all relevant variables and panels to the new data source added in the previous step.
Modify a variable.
On the Variables page, click New variable.
On the page that appears, configure the parameters and click Apply. The following table describes the parameters:
Parameter
Description
Select variable type
The variable type. Select Query from the drop-down list.
Name
The variable name. You can specify a custom name.
Show on dashboard
The way to display metrics on the dashboard. Select Label and value.
Data source
The data source name. Select the variable name that you specified in the previous step. Example:
${query01}.Query
The method to query metrics. Select Query Type, Label, or Metric based on your business requirements.
Sort
The way to sort the values of the variable. Select Disabled from the drop-down list.
Refresh
The time to refresh the values of the variable. Select On dashboard load.
Modify a panel.
Return to the Dashboards page and click the
 icon in the upper-right corner of the panel for which you want to modify the data source. Then, click Edit from the drop-down list.
 On the Query tab of the Edit Panel page, select the variable name that you specified in the previous step from the Data source drop-down list, such as
${query0}.
In the upper-right corner of the page, click Apply.
In the upper-right corner of the Dashboards page, click the
icon. In the left-side navigation pane, click JSON Model. On the JSON Model page, replace
datasourcein the code with the variable name that you specified in the previous step.Example: "datasource": { "type": "Prometheus", "uid": "${query01}" },Click Save changes.
After the modifications take effect, you can view the dashboards of different data sources by switching data sources on the Dashboards page.
