Function Compute integrates with Simple Log Service. After you configure logging for a function, Function Compute automatically collects logs and delivers them to a Logstore in a specified project. You can view request logs, instance logs, and function logs in the Function Compute console. You can also use the log analysis features in the Simple Log Service console to run custom log queries.
Background information
Simple Log Service is a one-stop service for log data. It provides a full range of capabilities, including log collection, storage, query, analysis, visualization, and alerting. To store function logs in Simple Log Service, you must configure a project and a Logstore for the function and grant the function permissions to access Simple Log Service. After the configuration is complete, function logs are written to the specified Logstore.
Billing
Billing methods
Function Compute does not charge extra fees for the logging feature. After logs are delivered to Simple Log Service, you are charged by Simple Log Service.
If a Logstore uses the pay-by-feature billing method, Simple Log Service charges for storage space, read traffic, requests, data transformation, and data shipping after Function Compute delivers logs to it. For more information, see Billable items of the pay-by-feature billing method.
If a Logstore uses the pay-by-write-volume billing method, Simple Log Service charges for items such as the raw data write volume after Function Compute delivers logs to it. For more information, see Billable items of the pay-by-write-volume billing method.
To change the billing method of a Logstore, see Manage a Logstore.
Stop billing
To stop billing, first disable the logging feature in the Function Compute console. Then, go to the Simple Log Service console to delete the Logstore or delete the project.
Deleting a Simple Log Service project or Logstore is an irreversible operation. After deletion, logs can no longer be delivered to Simple Log Service, and existing data is deleted. Be sure to back up important log data before you perform this operation.
Enable the logging feature for a function
Use the Function Compute console to configure logging
Prerequisites
Function Compute
Optional: Simple Log Service
Procedure
Log on to the Function Compute console. In the left-side navigation pane, click Functions.
In the top navigation bar, select a region. On the Functions page, click the function that you want to manage.
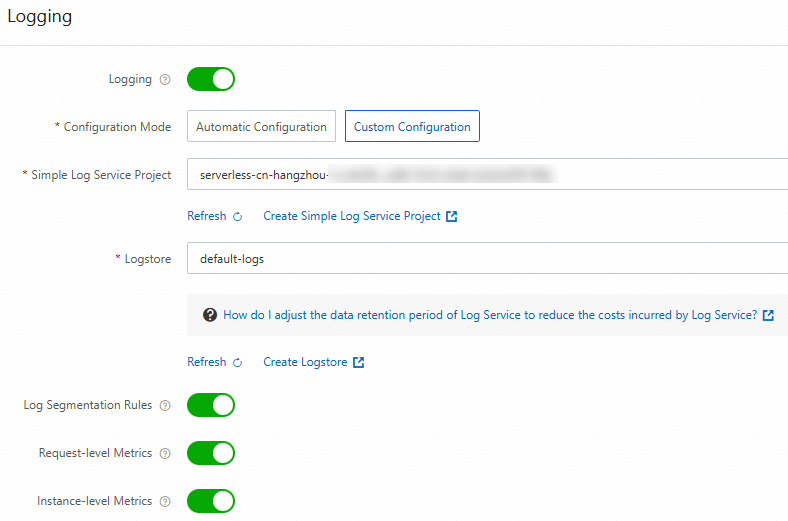
On the function details page, click the Configuration tab and then click Edit to the right of Advanced Configuration. In the Advanced Configuration panel, find the Log section, configure the log settings, and then click Deploy.
 Note
NoteWhen you create a function, the logging feature is enabled by default. The system automatically selects a Log Project that starts with
serverless-<region_id>and a default Logstore.The console automatically enables Log Segmentation Rules, Request-level Metrics, and Instance-level Metrics, and creates all indexes required to query logs.
Parameter
Required
Description
Logging
Yes
Enable or disable the logging feature. Valid values:
Enable: If you enable the logging feature, Function Compute imports logs to your project. You can then query and retrieve logs in the Function Compute console or the Simple Log Service console to troubleshoot issues.
Disable: If you do not enable the logging feature, function logs are not persisted. This makes it difficult to track and identify issues.
Configuration Mode
Yes
Select Automatic Configuration or Custom Configuration. If you select Custom Configuration, you must specify the Log Service Project and Logstore.
Log Project
Yes
The destination project that stores function invocation logs.
Logstore
Yes
The destination Logstore that stores function invocation logs.
Log Segmentation Rules
No
Enable or disable log segmentation rules. Valid values:
Enable: If you enable log segmentation, Function Compute splits logs into multiple segments based on the segmentation rule and writes them to Simple Log Service one by one.
The default log segmentation rule is
^.{0,2}\d{4}-\d{2}-\d{2}. This rule matches dates that use thexxxx-xx-xxformat, wherexrepresents a digit. The rule splits logs based on whether the first line contains a date. For example, if the first line of your log is 2023-10-10, this line is considered the first line of a log segment. This line and the subsequent lines that do not start with a date are written to Simple Log Service as a single log entry.Disable: If you disable log segmentation, logs are split using
\nby default.
Request-level Metrics
No
Enable or disable the import of request metric logs to the Logstore. Enabling this feature is highly recommended.
Valid values:
Enable: If you enable this feature, metrics for each function invocation are delivered to the Logstore that you selected. These metrics include the running time, memory usage, execution errors, cold start status, and the duration of each cold start step. Function Compute can display a list of requests based on these metrics in the invocation logs. You can also filter requests based on the metrics, such as filtering all error requests or requests that involve cold starts.
Disable: You cannot view the detailed execution information of requests.
Instance-level Metrics
No
Enable or disable the instance-level metrics feature. Valid values:
Enable: If you enable this feature, metric data of function instances is delivered to the Logstore that you selected. You can view performance metrics at the function instance dimension, such as the CPU, memory, and network I/O metrics of an instance. Function Compute provides instance-level observability based on instance-level metric data. This gives you an end-to-end monitoring and troubleshooting path for function instances. For more information, see Instance-level metrics.
Disable: You cannot view the details of instance metrics.
Use Serverless Devs to configure logging
Prerequisites
Procedure
Create a code directory. The following sample code shows the directory structure.
.
├── code
│   └── index.js
└── s.yaml
The following sample code shows an s.yaml file.
In this example, the logConfig field is used to configure the logging feature. You must change the values of logstore and project to your existing Logstore and project. You can also set logConfig to auto. In this case, the Function Compute platform automatically specifies the logstore and project.
edition: 3.0.0
name: hello-world-app
access: "default"
vars: # Global variables
  region: "cn-hangzhou"

resources:
  hello_world:
    component: fc3 # Component name
    props:
      region: ${vars.region}
      functionName: "start-nodejs-****"
      description: 'hello world by serverless devs'
      runtime: "nodejs16"
      code: ./code
      handler: index.handler
      memorySize: 128
      timeout: 30
      logConfig: # Change the values of logstore and project to your actual Logstore and project. You can also set logConfig to auto to automatically create a project and a Logstore.
        enableInstanceMetrics: true  # Enable instance-level metrics.
        enableRequestMetrics:  true  # Enable request-level metrics.
        logBeginRule: DefaultRegex   # Log segmentation rule.
        logstore: 'your-logstore'    # Specify the Logstore name. The Logstore must be created in advance.
        project: 'your-project'      # Specify the project name. The project must be created in advance.
Run the following command to deploy the application.
sudo s deploy -yAfter the command runs successfully, you can log on to the Function Compute console to verify that the function is deployed and the logging feature is enabled.
Disable the logging feature
After you disable the logging feature, function execution logs are no longer collected or stored. This may affect troubleshooting and performance analysis. Proceed with caution.
Log on to the Function Compute console. In the left-side navigation pane, click Functions.
In the top navigation bar, select a region. On the Functions page, click the function that you want to manage.
On the function details page, click the Configuration tab and then click Edit to the right of Advanced Configuration. In the Advanced Configuration panel, find the Log section, turn off the Log Feature switch, and then click Deploy.
View invocation logs
On the function details page, click the Logs tab to view the invocation records of the function.
On the function details page, you can click the Version Management or Alias Management tab, select a function version or alias to go to its details page, and then click the Logs tab to view the corresponding logs.
You can view function invocation logs on the Invocation Requests tab or the Search By Keyword tab. The following list describes the differences between the information displayed on the two tabs:
Invocation Requests
This tab lists the function invocation end time, request ID, invocation result, instance ID, and function version/alias.
You can click the corresponding Request ID to view the request and log details.
You can click the corresponding Instance ID to view the resource usage of the instance, such as CPU usage, memory usage, and network traffic.
You can click Request Log in the Actions column to view the log details, or click Advanced Logs in the Actions column to open the Simple Log Service console to query and analyze logs.
Keyword Search
The function invocation time, log content, and function version or alias are displayed. You can click Log Context in the Actions column to query the context of a log entry, or click Logstore in the Actions column to open the Simple Log Service console to query and analyze logs.
You can enter a keyword in the search box to query logs. For example, if you want to search for logs that contain the text
hello world, you can enter the keywordhello worldin the search box. The search returns all log lines that contain the keyword. For more information about the syntax, see Search syntax and functions.
References
You can also call an SDK or an API operation to configure logging for a function. For more information, see CreateFunction.