When a function fails or behaves unexpectedly, function-level aggregates rarely tell you which instance caused the problem. Instance-level metrics give you per-instance visibility into vCPU usage, memory consumption, network throughput, and concurrent request count — so you can pinpoint CPU saturation, memory pressure, or network anomalies on individual instances.
If you've already enabled collection, go to View metrics.
How do I set the right number of concurrent requests for a single instance?
How it works
Function Compute collects performance metrics from each instance at regular intervals and writes them to logs. The metrics are available in two dimensions:
Function or qualifier: aggregated view across all instances running the same function. For example, if two instances run Function A simultaneously, the vCPU metric for that function reflects the higher of the two utilization values.
Instance: metrics scoped to a single instance.
A qualifier is the version information passed when a function is invoked — either a version number or an alias. Instances are dynamically created and reclaimed by Function Compute; you cannot perform operations on them directly.
Metrics reference
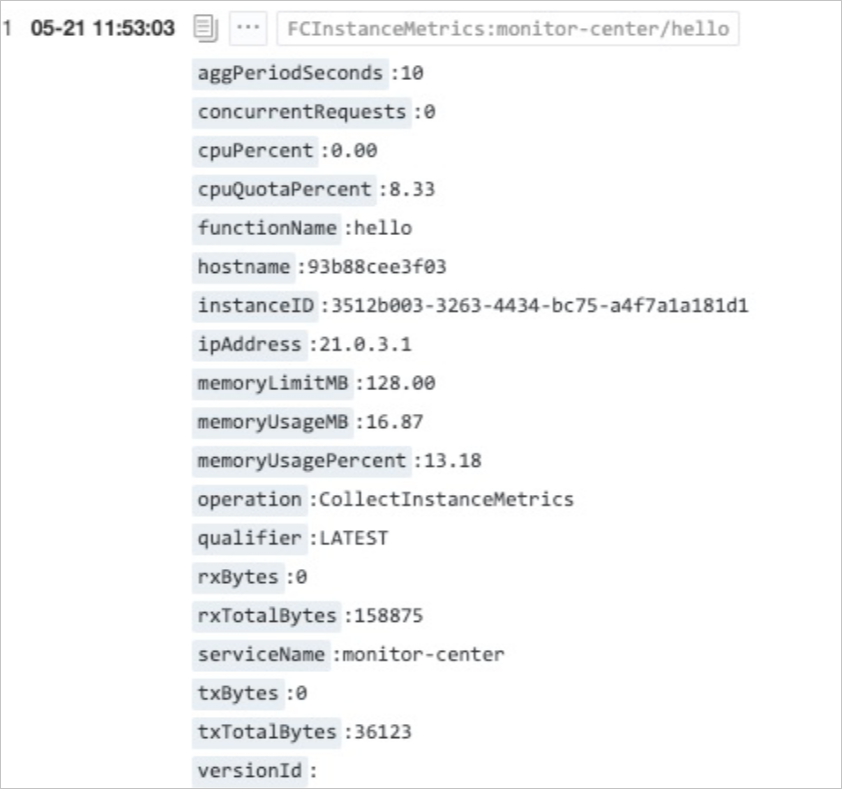
The following table describes all instance-level metrics. Each metric is recorded in the instance log at the collection interval.
| Metric | Description | Unit | Example value |
|---|---|---|---|
cpuPercent | vCPU usage of the instance. Reflects the number of vCPUs consumed. Can exceed 100% when the instance preempts CPU resources from other instances on the same host. | % | 120 |
cpuQuotaPercent | Maximum vCPU quota allocated to the instance. The vCPU-to-memory ratio (vCPU:GB) must be between 1:1 and 1:4. This is a theoretical ceiling; actual usage (cpuPercent) may exceed it. | % | 50 |
memoryUsageMB | Memory consumed by the instance. | MB | 16.87 |
memoryLimitMB | Maximum memory the instance can use. | MB | 1024 |
rxBytes | Inbound traffic received by the instance during the current collection interval. | bytes | 158 |
txBytes | Outbound traffic sent by the instance during the current collection interval. | bytes | 1598 |
rxTotalBytes | Total inbound traffic received since the instance started. | bytes | 158875 |
txTotalBytes | Total outbound traffic sent since the instance started. | bytes | 36123 |
concurrentRequests | Number of requests the instance is currently processing. | — | 10 |
hostname | Name of the host on which the instance runs. | — | 36123 |
A small amount of inbound and outbound traffic is generated by communication between the instance and internal system modules, even when your function code makes no network calls. Instance traffic includes both Internet and private network traffic combined; it cannot be used to calculate Internet traffic fees.
Enable instance-level metrics
Log on to the Function Compute console. In the left-side navigation pane, click Functions.
In the top navigation bar, select a region. On the Functions page, click the function you want to configure.
On the function configuration page, click the Configurations tab.
Click the Logs tab, then click Edit. In the log panel, turn on Instance-level Metrics and click OK.
If logging is not enabled on the function, enable it in the log panel during this step and configure the required parameters before turning on Instance-level Metrics.
View metrics
After enabling instance-level metrics, view the data in either of the following ways:
Monitoring Center (built-in): On the function details page, click the Monitoring tab. The dashboard displays both function-level and instance-level views, including vCPU usage, memory usage, network status, and concurrent request count.
Simple Log Service: Function Compute exports instance-level metrics to Simple Log Service, where you can build custom dashboards using its analytics capabilities.