The simulation event analysis feature allows you to compare the difference between the execution results when the primary event and the simulation event use different sets of policies. This helps determine which set of policies is more suitable. This topic describes how to use the simulation event analysis feature.
Tag analysis
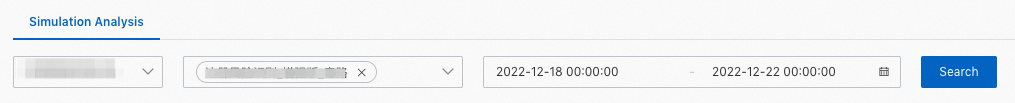
Select the primary event, simulation event, and time range. Then, click Search.
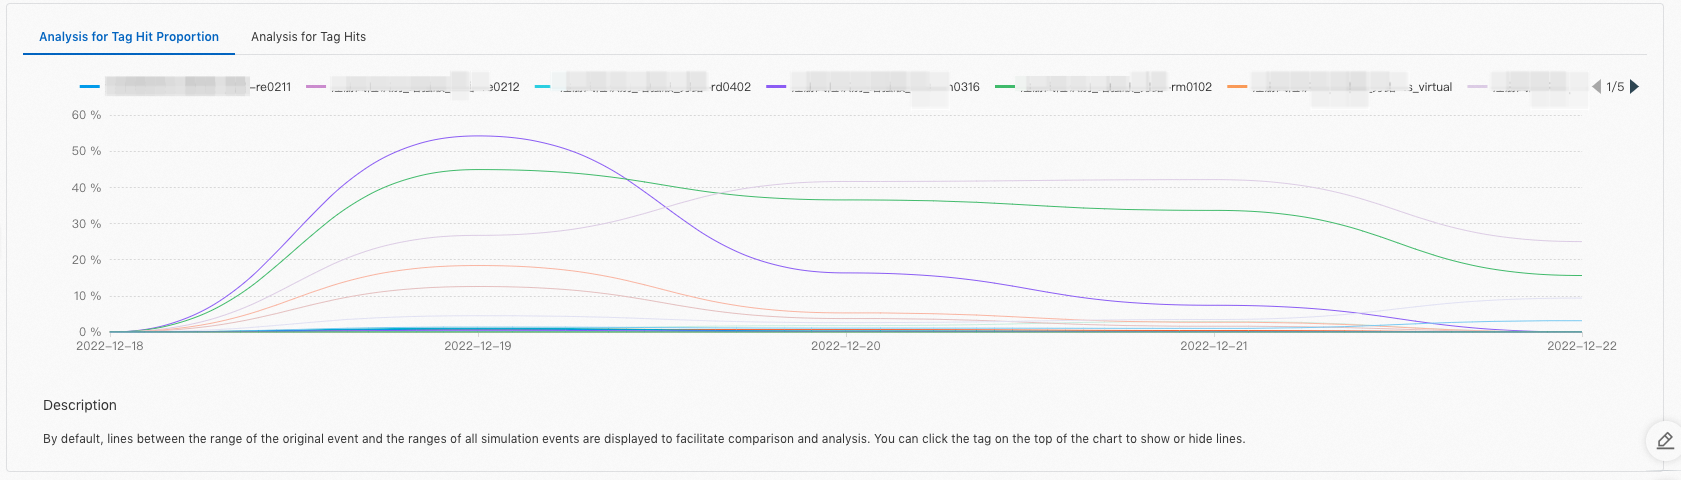
Click the Analysis for Tag Hit Proportion tab and the Analysis for Tag Hits tab to view the execution results of the two sets of policies.
Click the name of a tag to show or hide the line chat of the tag. By default, all hit tags are displayed.
Score analysis
Click the Proportion Analysis for Scores tab and the Quantity Analysis for Scores tab to view the execution results of the two sets of policies.
The following table describes the score ranges.
Score range | Risk level |
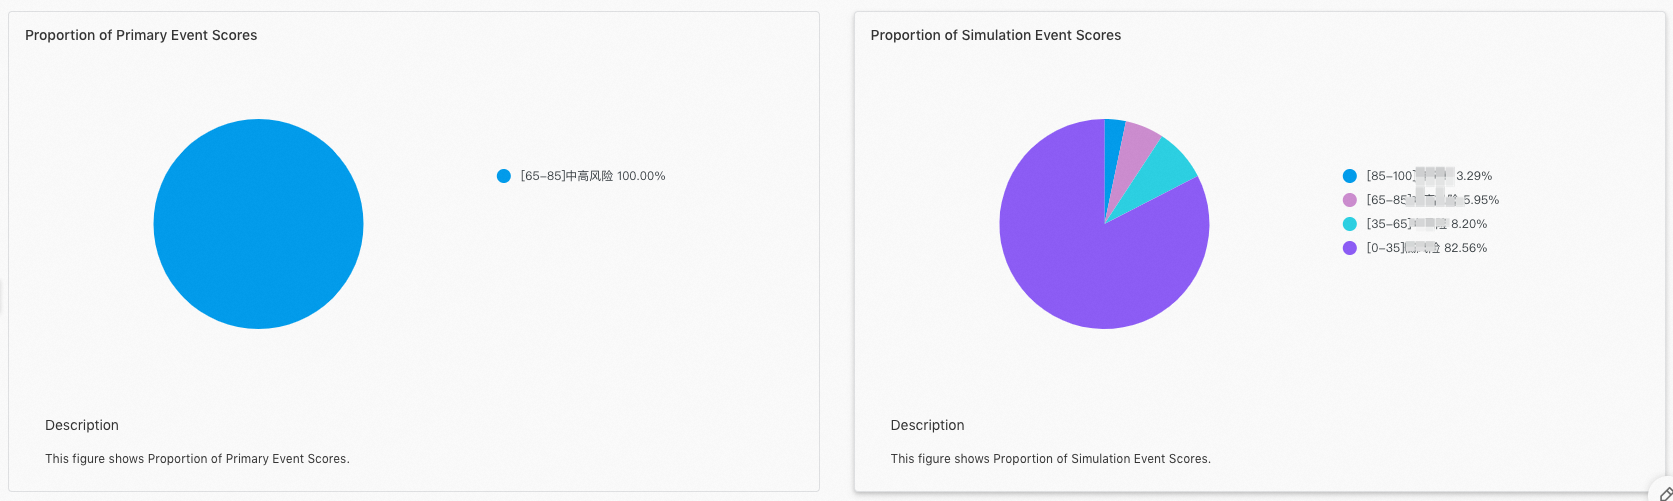
[0‒35) | Low risk |
[35‒65) | Medium risk |
[65‒85) | Medium-high risk |
[85‒100] | High risk |
Click a score range to show or hide the line chat of the score range. By default, all score ranges are displayed.

Proportions of score ranges
View the proportions of the score ranges for the two sets of policies.
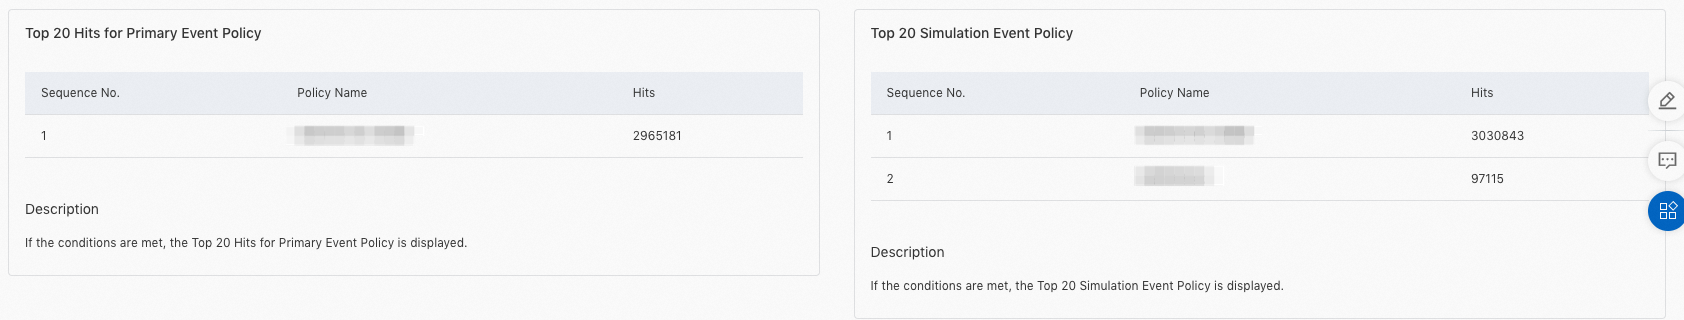
Hit policy analysis
View the hits of different policies in the two sets of policies. By default, the top 20 hit policies in each set of policies are displayed.