When running Flink jobs in production, performance issues such as resource bottlenecks and data lag can go undetected without proper monitoring. Integrating your Flink workspace with Application Real-Time Monitoring Service (ARMS) — specifically its Managed Service for Prometheus sub-service — gives you real-time visibility into Flink performance metrics and lets you set up alerts to catch issues early.
Prerequisites
Before you begin, ensure that you have:
-
Managed Service for Prometheus activated. See the Activation method section in the Prometheus Instance Billing topic.
-
Realtime Compute for Apache Flink activated. See Create a workspace.
-
Resource Center activated. See Activate Resource Center.
Integrate your Flink workspace
-
Log on to the Managed Service for Prometheus console. In the left-side navigation pane, click Integration Center.
-
In the search box, enter
flink. Select the Alibaba Cloud Flink Service Monitor card. -
In the Alibaba Cloud Flink Service Monitor dialog box, select the Start Integration tab. Select the target Flink workspace from the drop-down list, then click OK.
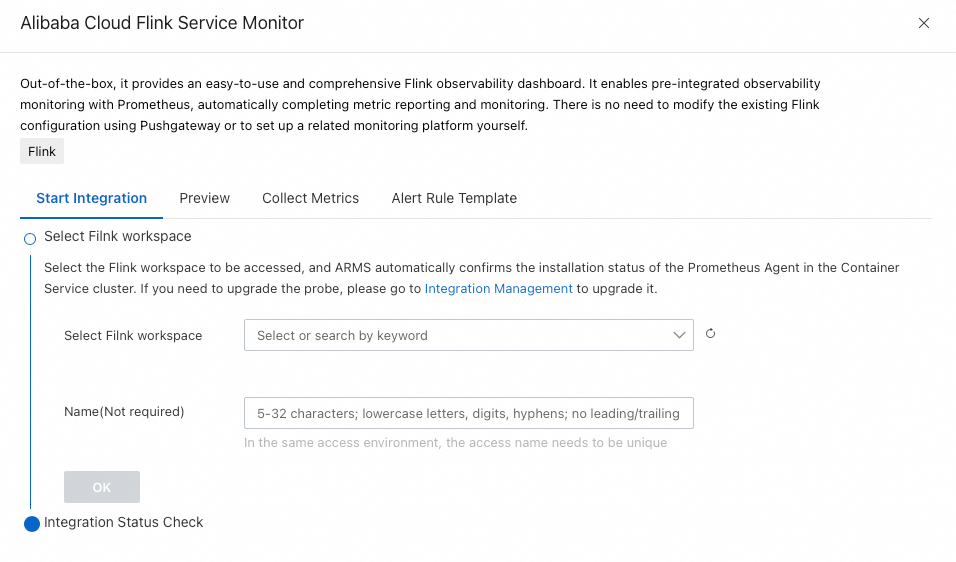
Integration takes 1–2 minutes. Dashboard data is unavailable until integration is complete.
View dashboards
Managed Service for Prometheus provides three built-in dashboards for Flink:
-
Flink Monitoring
-
Flink Session Cluster Monitoring
-
Flink Change Data Capture Monitoring
To view a dashboard:
-
Log on to the Managed Service for Prometheus console. In the left-side navigation pane, click Integration Management.
-
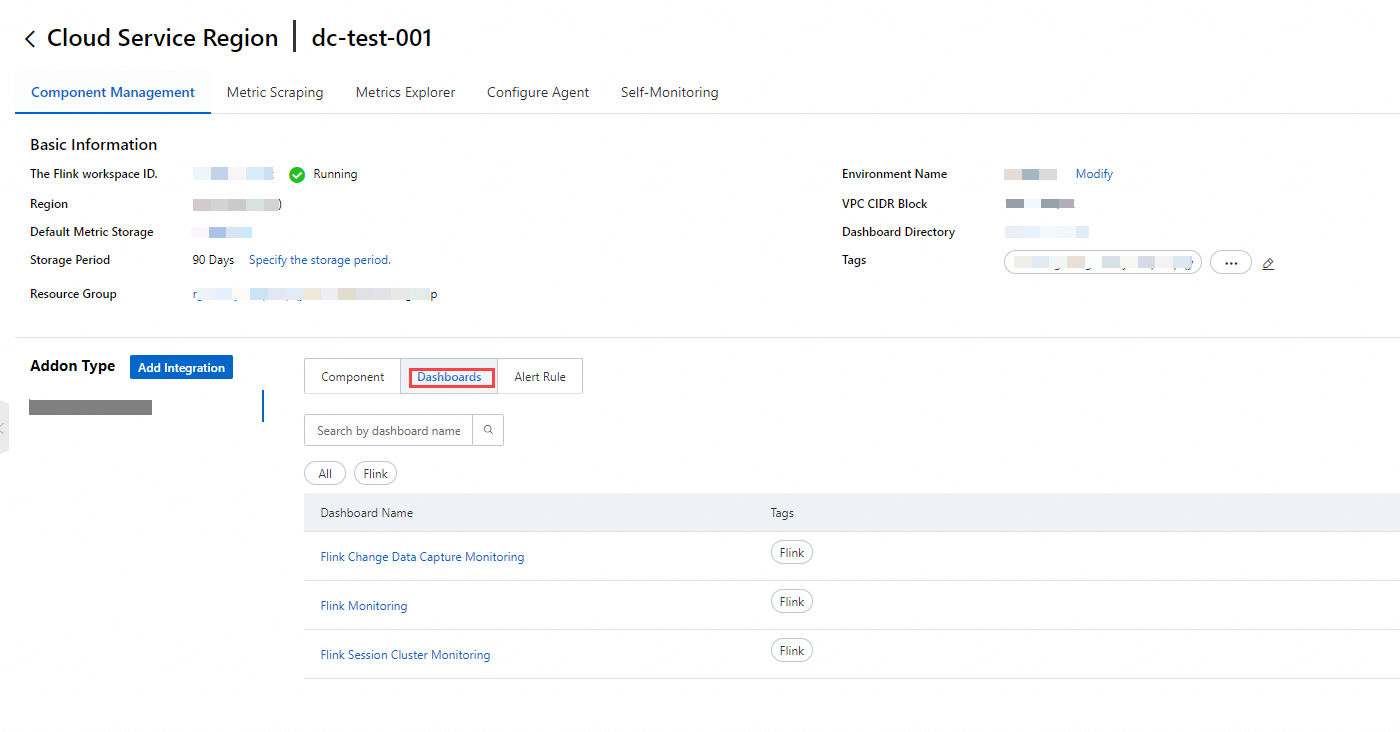
On the Integration Management page, select the Integrated Environments tab. Choose Cloud Service Region below the tab bar, then click the name of your Flink workspace.
-
Select the Component Management tab. In the Addon Type section, select Dashboards. The built-in Prometheus dashboards for Flink are displayed.
Create alert rules
-
Log on to the Managed Service for Prometheus console. In the left-side navigation pane, click Instances.
-
Click the target instance to open its details page.
-
In the left-side navigation pane, select Alert rules, then click Create Prometheus Alert Rule. Configure the following parameters: For a full list of parameters, see Create an alert rule for a Prometheus instance.
Parameter Description Check Type Select Static Threshold or Custom PromQL for metrics not already supported by Realtime Compute for Apache Flink. Filter Conditions Namespace Set to the name of the target Flink namespace. Deployment Name Set to the value of the Deployment ID field in the Basic section of the Configuration tab on the Deployments page. To apply the rule to a specific deployment, select Equal.