Operator profiling lets you inspect the input and output of selected operators in a running SQL job — without modifying or restarting the job. Use it to pinpoint data correctness issues quickly and keep your real-time services running.
When a Flink SQL job produces unexpected output, the typical approach is to break the job into smaller pieces and print intermediate results using the Print connector. This is time-consuming and may fail because test data often differs from production data or state. Operator profiling solves this by sampling operator I/O directly from the live job, so you work with real data in real conditions.
Limitations
-
Only running SQL jobs are supported.
-
The job must use Ververica Runtime (VVR) 8.0.4 or later.
-
Jobs that use CREATE TABLE AS (CTAS) or CREATE DATABASE AS (CDAS) statements are not supported.
-
Jobs deployed to session clusters are not supported.
-
Only one profiling operation can run at a time. Start a new one only after the current one stops.
Prerequisites
Before you begin, ensure that you have:
-
A running SQL job on VVR 8.0.4 or later
-
Access to the Realtime Compute for Apache Flink console
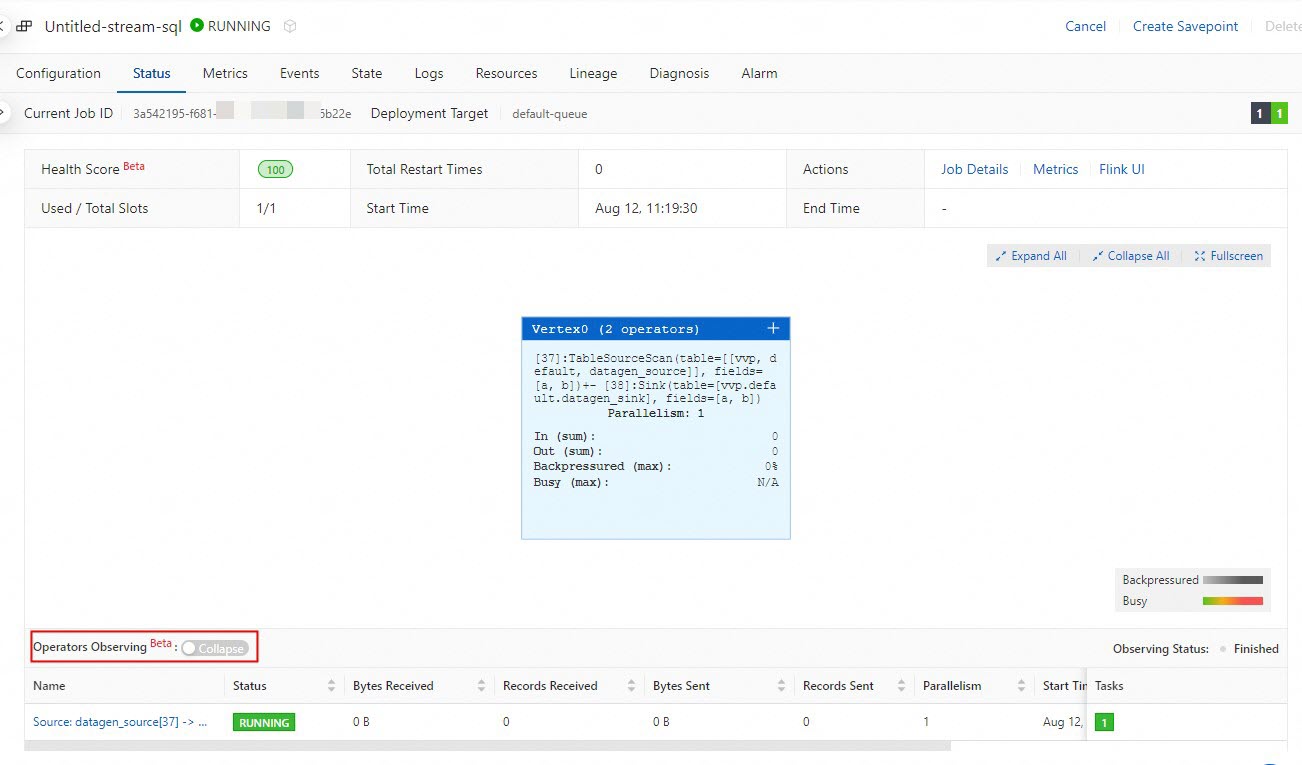
Profile an operator
-
Log on to the Realtime Compute for Apache Flink console. In the Operation column of the target workspace, click Console.
-
In the left navigation pane, choose Operation Center > Jobs.
-
Click the name of the target job, then click the Overview tab.
-
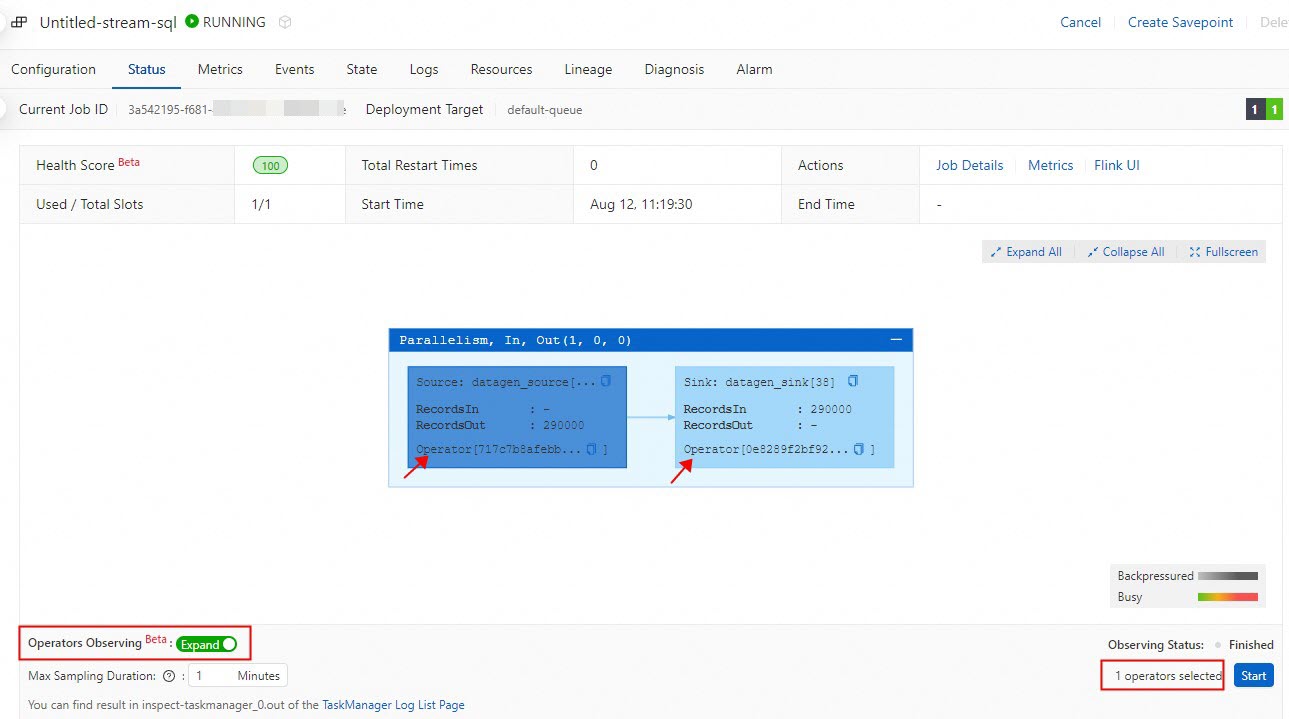
Enable operator profiling.
-
Turn on the Operator Profiling switch.
-
Select one or more operators to profile.
-
Set the maximum sampling time. The valid range is 1 to 30 minutes. If the storage limit is reached before the time expires, sampling stops early.
-
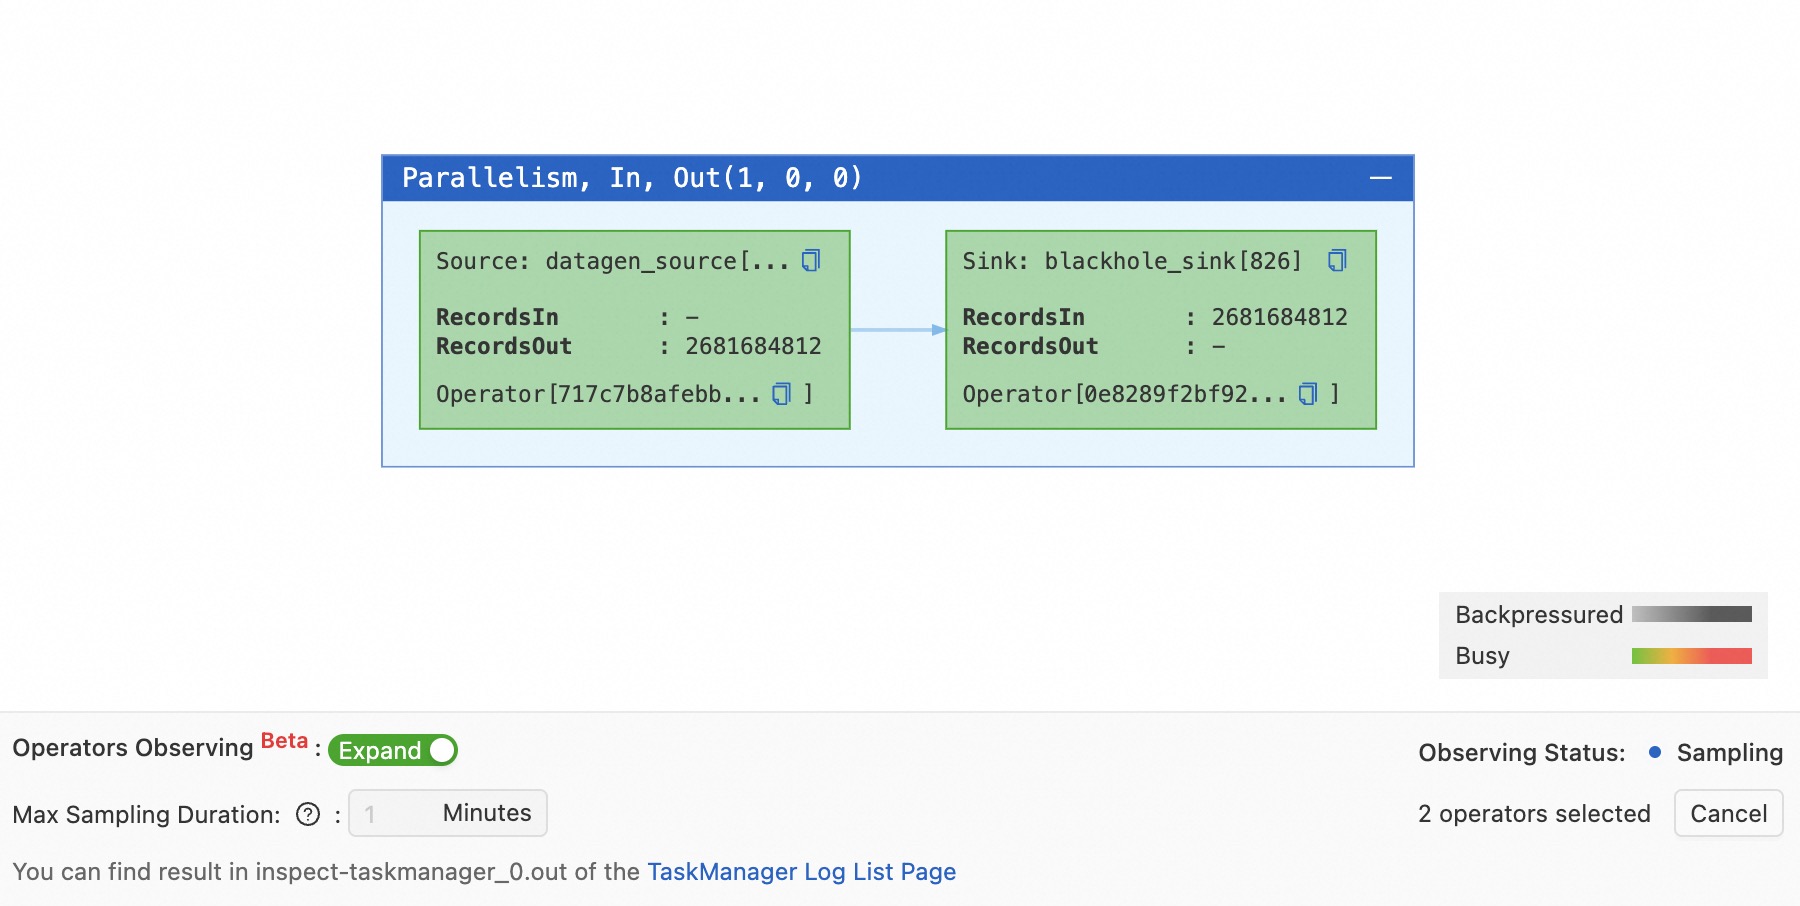
Click Start Profiling. The Profiling Status changes to Sampling.
-
-
View the profiling results. Click TM Log List in the prompt to open the operational log page. Find the log entry whose Log Name is
inspect-taskmanager_0.out. To locate the output of a specific operator, copy the operator name from the directed acyclic graph (DAG) on the Overview tab, then search for it on the log page.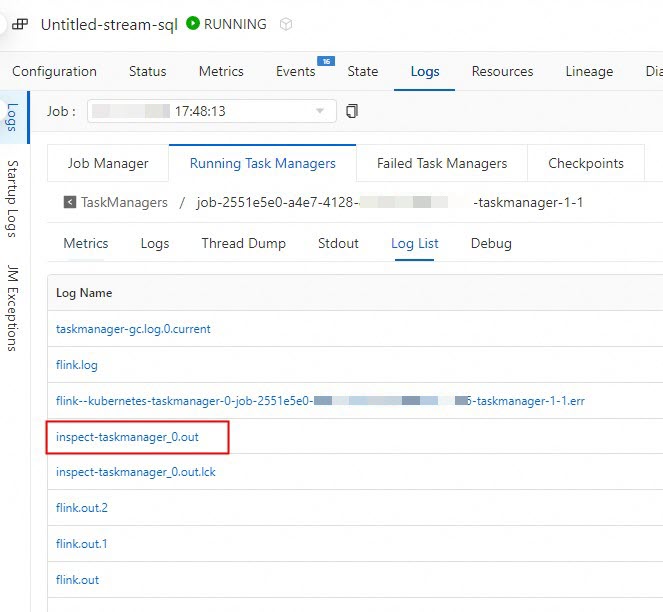

Stop conditions
Profiling stops automatically in any of the following situations:
-
A JobManager (JM) or TaskManager (TM) failover occurs.
-
The storage limit is reached during sampling.
-
The specified sampling time expires.
You can also manually stop profiling at any time.