Monitoring and log FAQ
This topic answers frequently asked questions about monitoring, alerting, and logs for Realtime Compute for Apache Flink.
-
How do I check the monitoring service type used by a workspace?
-
What are the limitations of CloudMonitor alerts compared to ARMS?
-
How do I disable the Prometheus Service that is automatically enabled?
-
How do I configure monitoring and alerting for Flink job restarts?
-
How do I view, search, and analyze historical Flink operational logs?
-
How do I resolve the issue where logs from non-static methods are not output to SLS?
-
Data is written correctly, but the Flink job status overview shows 0 data. What should I do?
-
What should I do if a DataStream job has no delay, but the output curve shows a delay?
How do I check the monitoring service type used by a workspace?
The monitoring service type is selected when you create a workspace and cannot be changed afterward. To check which type your workspace uses, go to Operation Center > Job O&M and click a job name. If the Alert Configuration tab appears, the workspace uses the pay-as-you-go Prometheus Service, which is part of Application Real-Time Monitoring Service (ARMS). If the tab is absent, the workspace uses the free CloudMonitor service. For configuration instructions for each service type, see Job monitoring and alerting.

What are the limitations of CloudMonitor alerts compared to ARMS?
CloudMonitor has three limitations compared to ARMS:
-
Query analysis syntax is not supported.
-
Curves at the subtask granularity are not available. In scenarios with multiple sources and subtasks, this makes it difficult to quickly locate latency issues after clustering.
-
Metrics from custom instrumentation in user code cannot be viewed, which can complicate troubleshooting.
How do I configure or add an alert contact?
When using CloudMonitor or ARMS console alerts, add or configure contacts in the corresponding console. For details, see Configure monitoring and alerting.
If your workspace uses ARMS and you configure metric or job failure alerts for a single job directly in the Realtime Compute for Apache Flink development console, follow these steps to add or configure alert contacts.
-
Access the alert configuration page.
-
Log on to the Realtime Compute for Apache Flink management console. In the Operation column of the target workspace, click Console.
-
On the Operation Center > Job O&M page, click the target job name.
-
Click the Alert Configuration tab.
-
-
On the Alert Rules tab, choose Add Alert Rule > Custom Rule to open the create rule panel.
-
Configure or add an alert contact.
-
Add: Click Notification Recipient Management next to the Notification Recipient parameter to add contacts, DingTalk robots, and more. For information about configuring alerts for DingTalk robots, webhooks, and Lark robots, see the FAQ section of the alerting guide. After you add a contact, if you use phone calls for alerts, ensure the recipient's phone number is verified. Otherwise, the alerts will not be delivered. If the Unverified label appears in the Phone column for the target contact on the Contacts tab, click the label to complete the verification.

-
Configure: For the Notification Recipient parameter, select the desired alert contacts. If the contact is not listed, add it following the steps above.
-
How do I disable the Prometheus Service that is automatically enabled?
If you selected the pay-as-you-go Prometheus Service when you created your workspace, ARMS is automatically enabled. To stop using it, uninstall the Prometheus instance from the Prometheus console.
Important
Uninstalling the Prometheus instance for a workspace stops monitoring data collection for that workspace and results in the loss of job monitoring data curves. If a job becomes abnormal, you cannot locate the initial time of the abnormality or receive monitoring alerts. Proceed with caution.
-
Log on to the Prometheus console.
-
In the left navigation pane, click Instance List.
-
From the Tag Filtering drop-down list, select the ID or name of the target workspace.
-
Find the instance with Instance Type set to Prometheus for Flink Serverless and click Uninstall in the Operation column.
-
In the dialog box, click Confirm.
How do I find the job that triggered an alert?
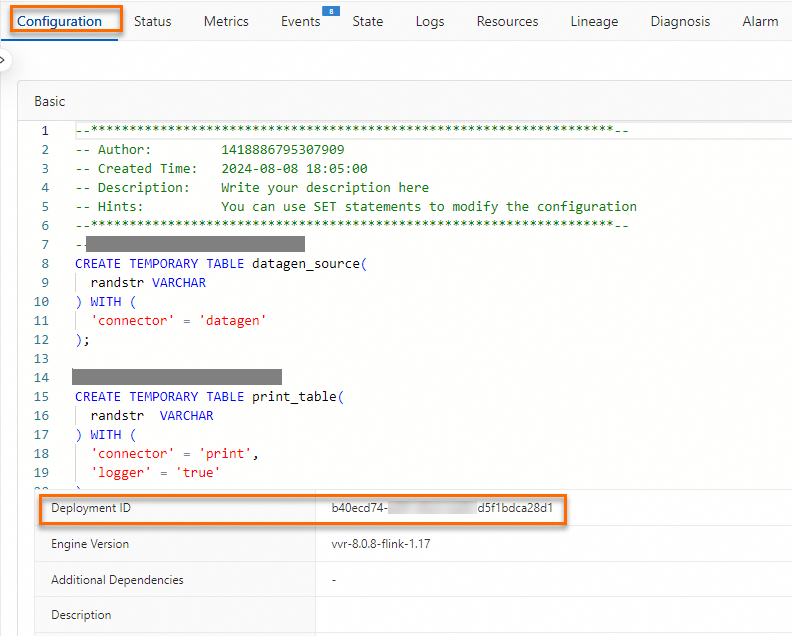
Alert events contain both a JobID and a Deployment ID. Because the JobID changes after a job failover, use the Deployment ID to identify the specific job that reported an error.
View the Deployment ID in either of these locations:
-
In the Realtime Compute for Apache Flink development console, on the Deployment Details tab, find the Deployment ID in the Basic Configuration section.
-
In the job's URL.

How do I configure monitoring and alerting for Flink job restarts?
The Realtime Compute for Apache Flink development console configures alert rules based on Flink metrics. Therefore, after a job failover, metric curves are not displayed, and alerts cannot be triggered. To alert on job restarts, configure a custom rule in ARMS based on the instantaneous growth rate of the flink_jobmanager_job_numRestarts metric. This allows alerting for job manager (JM) failover events.
-
Log on to the Realtime Compute for Apache Flink management console.
-
In the Operation column of the target workspace, click More > Monitoring Metrics Configuration to open the ARMS console.
-
On the Alert Rules page, click Create Prometheus Alert Rule.
-
Set Detection Type to Custom PromQL and select the alerting instance.
-
Enter a custom Prometheus Query Language (PromQL) expression. For example:
irate(flink_jobmanager_job_numRestarts{jobId=~"$jobId",deploymentId=~"$deploymentId"}[1m])>0This expression queries the
flink_jobmanager_job_numRestartsmetric over the last 1 minute and triggers an alert if the instantaneous rate of change is greater than 0. -
Click Finish.
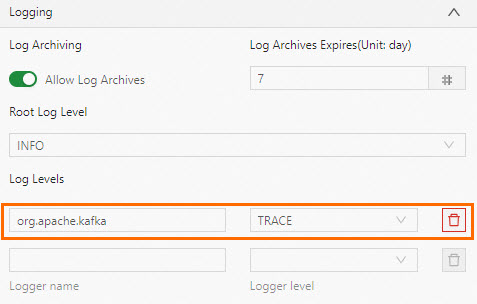
How do I set log level parameters for a single class?
Configure per-class log level parameters in Log Levels, not in Other Configuration. For example, to set Kafka connector log levels, add the following parameters to Log Levels:
-
log4j.logger.org.apache.kafka.clients.consumer=trace(for a source table) -
log4j.logger.org.apache.kafka.clients.producer=trace(for a sink table)
How do I enable GC log parameters?
On the Operation Center > Job O&M page, click the target job name. On the Deployment Details tab, under Parameter Settings, add the following configuration to Other Configuration and save to apply.
env.java.opts: >-
-XX:+PrintGCDetails -XX:+PrintGCDateStamps -Xloggc:/flink/log/gc.log
-XX:+UseGCLogFileRotation -XX:NumberOfGCLogFiles=2 -XX:GCLogFileSize=50M
A job fails to start after configuring logs for SLS
After configuring a job to output logs to Simple Log Service (SLS), the job fails with Job startup failed. Please retry. and the following error:
Unknown ApiException {exceptionType=com.ververica.platform.appmanager.controller.domain.TemplatesRenderException, exceptionMessage=Failed to render {userConfiguredLoggers={}, jobId=3fd090ea-81fc-4983-ace1-0e0e7b******, rootLoggerLogLevel=INFO, clusterName=f7dba7ec27****, deploymentId=41529785-ab12-405b-82a8-1b1d73******, namespace=flinktest-default, priorityClassName=flink-p5, deploymentName=test}}
029999 202312121531-8SHEUBJUJU
This error occurs when a Twig template variable — such as namespace or deploymentId — was accidentally modified during log configuration.
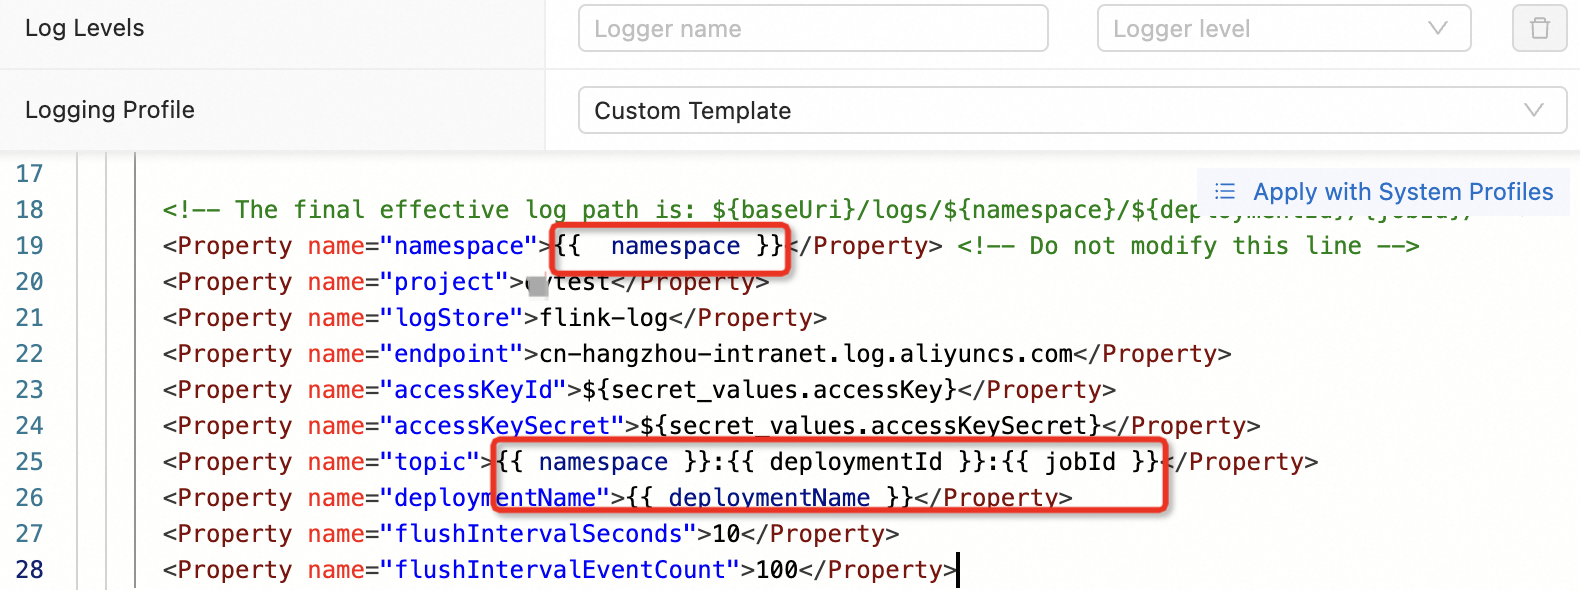
To fix this, reconfigure log settings by following Configure job log output. Do not modify Twig variables in the log configuration template.
How do I view, search, and analyze historical Flink operational logs?
Realtime Compute for Apache Flink provides two ways to access historical operational logs.
-
In the development console: On the Deployment Details tab, the Log Archiving feature is enabled by default with a retention period of 7 days. The most recent 5 MB of operational logs are retained. Adjust the Log Archive Retention Period as needed.

-
In external storage: Configure jobs to send logs to Object Storage Service (OSS), SLS, or Kafka, and set the log level for output. For details, see Configure job log output.

How do I resolve the issue where logs from non-static methods are not output to SLS?
Due to the implementation logic of the SLS Logger Appender, logs from non-static methods are not output to SLS.
Fix this by declaring your logger using the standard static pattern:
private static final Logger LOG = LoggerFactory.getLogger(xxx.class);Data is written correctly, but the Flink job status overview shows 0 data. What should I do?
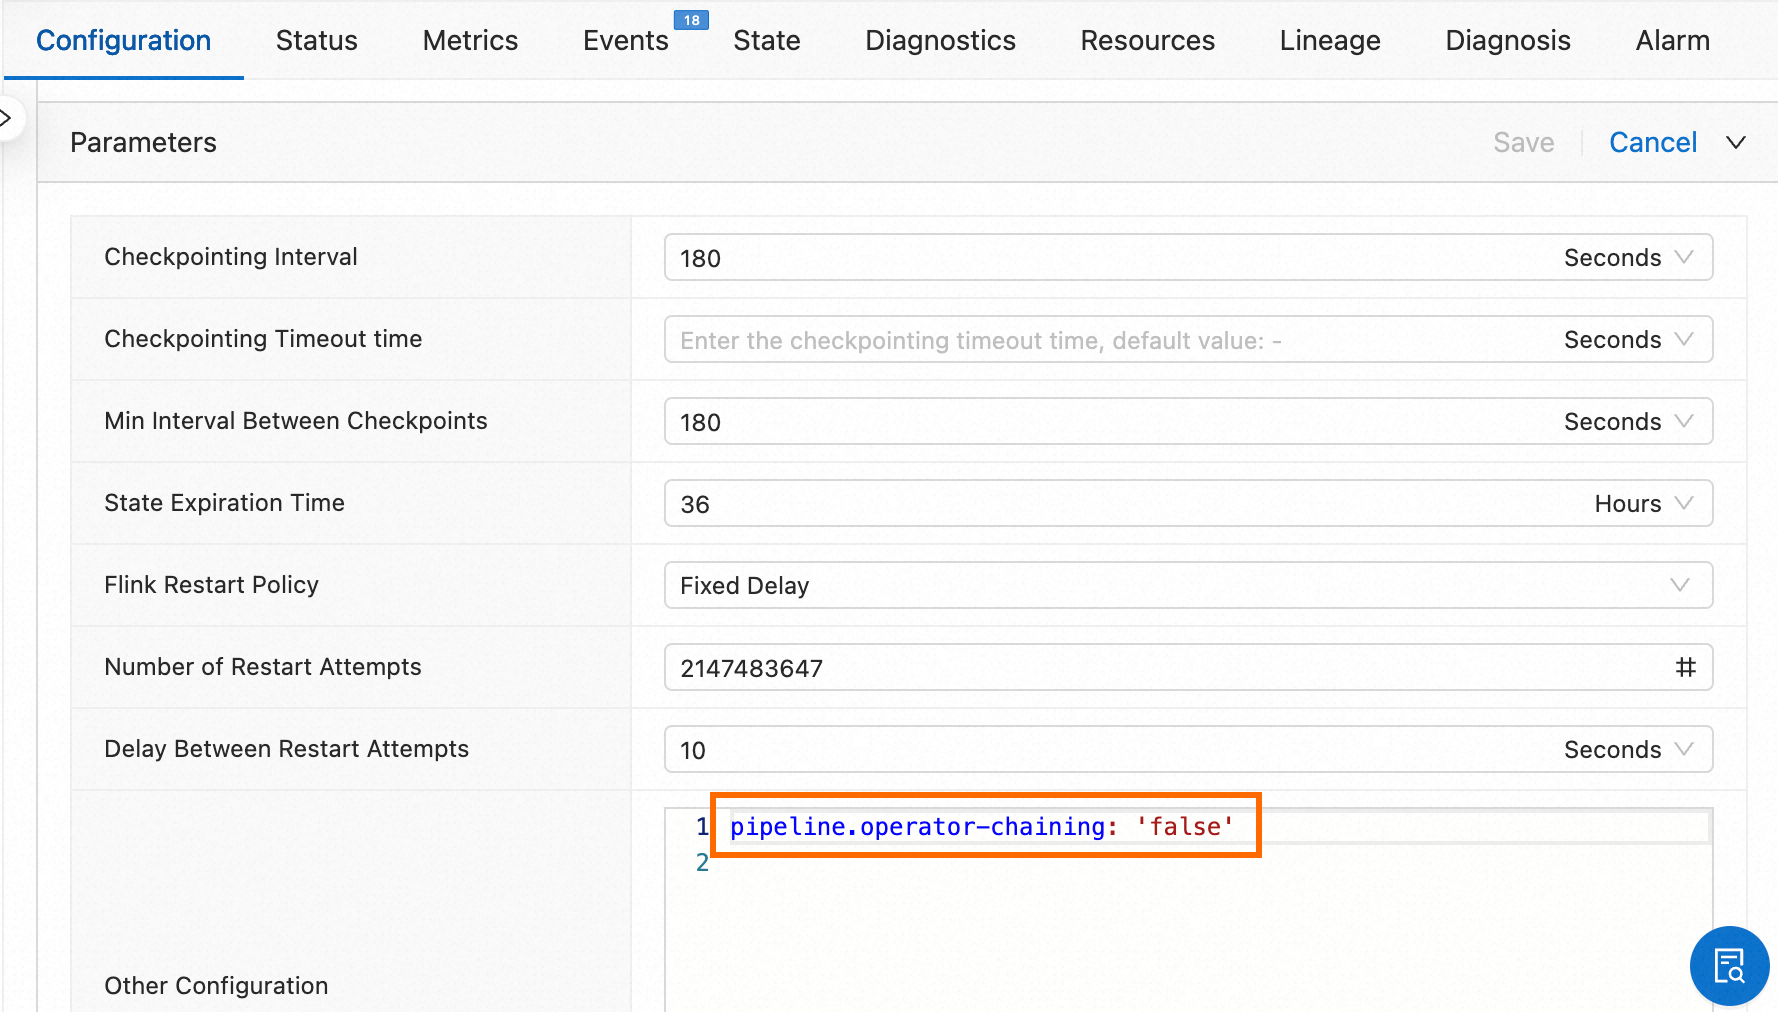
This happens when a job has only one node, with the source having only output and the sink having only input. In this topology, Flink does not display the data volume in the topology graph.
To view data traffic in the topology graph, split the source and sink operators into independent operators. Add the following parameter to Other Configuration under Parameter Settings on the Deployment Details tab:
pipeline.operator-chaining: 'false'Navigate to Operation Center > Job O&M, click the job name, then find Other Configuration under Parameter Settings on the Deployment Details tab.
What should I do if a DataStream job has no delay, but the output curve shows a delay?
If the CurrentEmitEventTimeLag and CurrentFetchEventTimeLag metrics show a delay of approximately 52 years, the job is using a community Kafka connector rather than the Flink built-in connector. Community connectors do not implement the metric reporting logic for these curves, causing the values to appear abnormal.
Switch to the Flink built-in connector dependency. Find the correct version on Maven Repository.
What should I do if a NullPointerException is thrown in the Task Manager (TM) logs of a DataStream job without a detailed stack trace?
The JVM omits stack traces for frequently thrown exceptions as a performance optimization. Add the following flag to Other Configuration under Parameter Settings on the Deployment Details tab to disable this behavior:
env.java.opts: "-XX:-OmitStackTraceInFastThrow"Navigate to Operation Center > Job O&M, click the job name, then find Other Configuration under Parameter Settings on the Deployment Details tab.
The currentFetchEventTimeLag metric shows an abnormally high value after a job restart with the Hologres connector
-
Symptom
After a Flink job using the Hologres connector restarts or resumes from a checkpoint, the
currentFetchEventTimeLagmetric briefly spikes to an extremely high value (hours or even days), then gradually returns to normal. -
Cause
The
currentFetchEventTimeLagmetric is calculated asSystem.currentTimeMillis() - record.getBinlogTimestamp() / 1000. This metric has the following characteristics:-
It is a transient snapshot value that is not persisted with checkpoints. After a job restart, it resets to its initial value of 0.
-
It is updated only when actual data records are consumed. Heartbeat records do not trigger an update.
After a job restart, the Hologres connector resumes consuming binlog from the last checkpoint position. Internal Hologres operations — such as compaction, schema changes, and partition maintenance — can produce historical binlog records with earlier timestamps. When these historical records are consumed, the large gap between the current system time and the record timestamp causes the metric to spike. The metric returns to normal after all historical data is consumed and the job catches up to real-time data.
-
-
Solution
This metric anomaly is a known behavior of the Hologres connector during job restarts and does not affect data processing correctness. Verify that the magnitude of the metric spike aligns with the job's idle time. The metric returns to normal levels after the job finishes consuming historical data and catches up to real-time data.