Express Connect integrates with CloudMonitor to provide real-time monitoring and alerting for Quality of Service (QoS) queues. You can monitor the status of QoS queues and receive notifications based on configured alert rules. This capability helps you efficiently monitor QoS queues and ensure that resource allocation complies with your policies.
Prerequisites
QoS policies can be associated only with dedicated ports that support advanced QoS capabilities. They cannot be associated with shared ports or Virtual Border Router (VBR) instances.
You have enabled billing for outbound traffic fee.
You have created a QoS policy and added queues to the policy.
View QoS queue monitoring data
Log on to the Express Connect Console.
In the top navigation bar, select the target region.
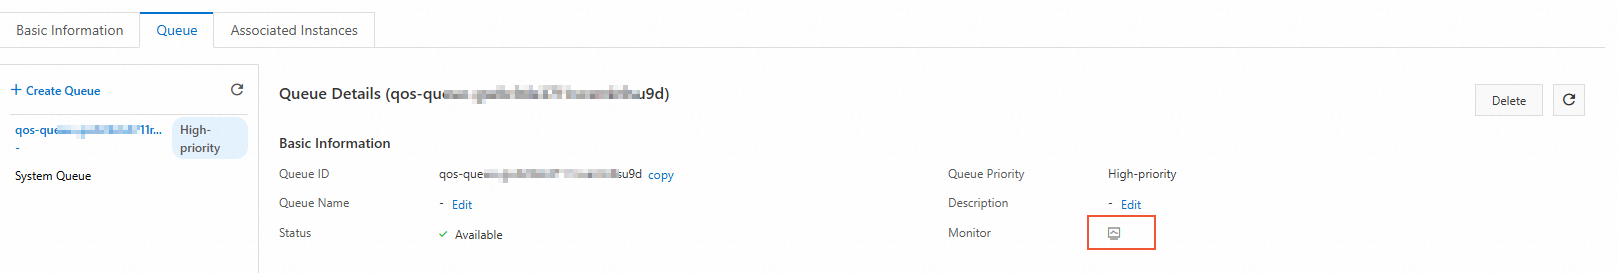
In the left-side navigation pane, select QoS Policies and click the target instance. On the Queue tab, in the Queue Details section, click the Monitoring icon to view monitoring data.
By default, the system displays monitoring data from the last hour. You can change the time range to 3, 6, or 12 hours, or set a Custom time range.
After you enable Auto Refresh, the monitoring chart is updated every minute.
Configure alert rules
Click the Monitor icon. In the upper-right corner, click Set Alert Threshold.
In the Set Rule Description panel, select a metric type, configure parameters such as the threshold and alert level, and then click OK.
For more information about how to configure other parameters and set complex alert conditions, see Create an alert rule and Expressions for alert rules.
Simple Metric: Select a monitoring metric, and then set the threshold and alert level.
Composite Metric: Select an alert level and then configure alert conditions for two or more monitoring metrics.
NoteIf you configure an alert rule for multiple metrics, the target resource must have monitoring data for each specified metric. An alert triggers only when all metric conditions are met. For example, if a multi-metric alert rule includes both the QoS queue rate and the QoS queue packet loss rate, the alert will not trigger if the packet loss rate does not exceed its threshold.
Expression: Select an alert level and then configure an alert expression.
Intelligent Threshold: For more information, see Overview and Create an Intelligent Threshold alert rule.
NoteThe Intelligent Threshold feature is in a private beta. Contact your account manager to apply.
QoS queue monitoring metrics
Metric | Description | Metric name | Statistics |
QoS queue rate | The data transfer rate of a QoS queue. Unit: bps. | QosQueueRate | Value |
QoS queue packet loss rate | The number of packets dropped per second in a QoS queue. Unit: pps. | QosQueueLossPkg | Value |
Related documents
For more information about how to manage QoS policies, see QoS policies.
For APIs related to QoS policies, see QoS policy API operations.
To view resources under alert and alert history in the CloudMonitor console, see View resources under alert and View alert history.