When you route events through a custom event bus, you need to verify that events are filtered, delivered, and processed as expected. EventBridge provides built-in metrics for each custom event bus, covering event rule matching, target delivery, ingestion volume, and downstream response times. Use these metrics to identify delivery failures, latency spikes, or unexpected drops in event volume.
Prerequisites
Before you begin, make sure that you have:
View metrics for a custom event bus
Log in to the EventBridge console.
In the left-side navigation pane, click Event Buses.
In the top navigation bar, select a region. On the Event Buses page, click the name of the custom event bus that you want to monitor.
In the left-side navigation pane, click Metric Monitoring.
On the Metric Monitoring page, review the following metrics.
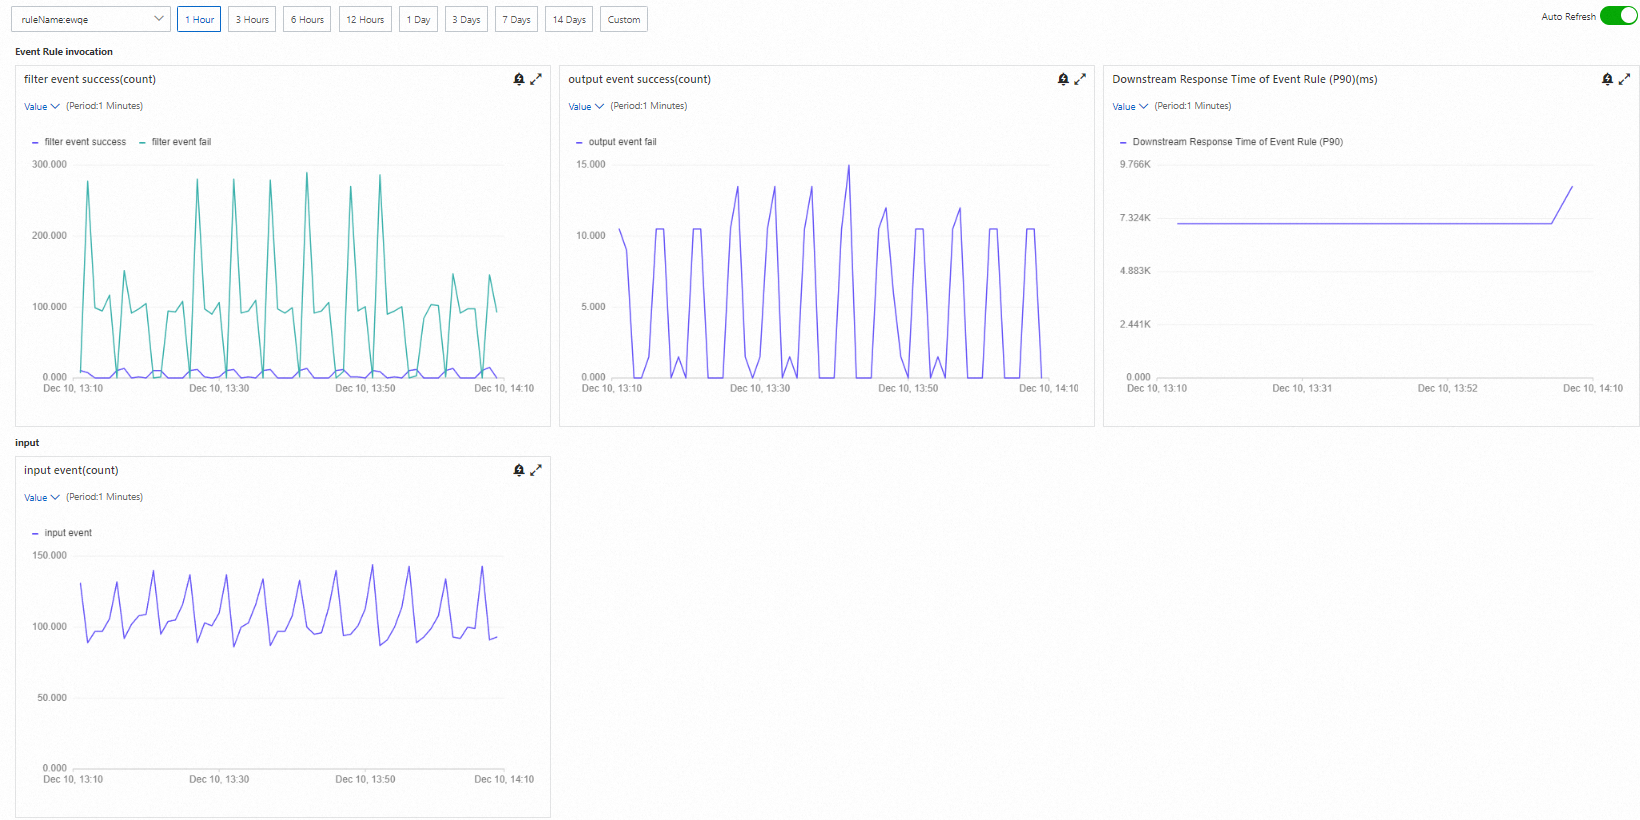
Event Rule invocation
These metrics show how event rules process and deliver events to targets:
Metric | Description |
filter event success(count) | The number of events that matched the filter conditions defined in the event rule. A sudden drop may indicate a rule misconfiguration or a change in the event schema. |
output event success(count) | The number of events successfully pushed to event targets such as Function Compute and WeCom. Compare this value with filter event success(count) to identify delivery failures. |
Downstream Response Time of Event Rule | The time for the event target to respond after receiving an event. A sustained increase may indicate that the target service is overloaded or undersized. |
Input
This metric tracks event ingestion into the custom event bus:
Metric | Description |
input event(count) | The number of events forwarded to the custom event bus. Monitor this value to detect unexpected drops in event volume from upstream sources. |
Customize the metrics view
You can adjust the time range, filter by event rule, and zoom in on individual charts:
Action | How to |
Change time range | Use the time selector in the upper part of the page. The default range is the past hour. |
Filter by event rule | If multiple event rules are configured for the custom event bus, select a specific event rule from the drop-down list in the upper part of the page. |
Zoom in on a chart | Click the |
 icon to the right of the metric chart.
Interpret metrics
Use these guidelines to identify common issues from the metrics:
Symptom | Possible cause | Action |
filter event success(count) drops to zero | Event rule filter pattern no longer matches incoming events | Check the event rule filter pattern against the current event schema. |
output event success(count) is lower than filter event success(count) | Target service is rejecting or failing to process events | Check the target service status, permissions, and error logs. |
Downstream Response Time of Event Rule increases | Target service is overloaded or experiencing latency | Scale the target service or optimize the event processing logic. |
input event(count) drops unexpectedly | Upstream event source stopped sending events | Verify the event source configuration and connectivity. |