Custom Message Queue for Apache Kafka connectors in EventBridge provide built-in monitoring across three dimensions: Kafka instance health, worker resource consumption, and connector task status. When a connector fails, the EventBridge console surfaces error details and provides direct access to connector logs for root cause analysis.
Monitoring dimensions
The Metric Monitoring page organizes metrics into three tabs, each focused on a different layer of the connector stack.
| Tab | What it monitors | When to use |
|---|---|---|
| Message Queue for Apache Kafka Instance Monitoring | Metrics for each connected Kafka instance | Check Kafka-side monitoring data |
| Worker Monitoring | Resource consumption of each Serverless App Engine (SAE) application and instance | Identify resource bottlenecks in the connector runtime |
| Connector Monitoring | Running status of Kafka Connect tasks | First place to check when a task fails -- shows failure details directly |
Kafka Connect workers run on SAE, so the resource usage of an SAE application or instance directly reflects the resource usage of the connector. The connector monitoring metrics are provided by Kafka Connect.
View monitoring metrics
Log on to the EventBridge console.
In the top navigation bar, select a region.
In the left-side navigation pane, click Event Streams.
On the Event Streams page, find the target Kafka connector and click Details in the Actions column.
In the left-side navigation pane, click Metric Monitoring.
Kafka instance monitoring
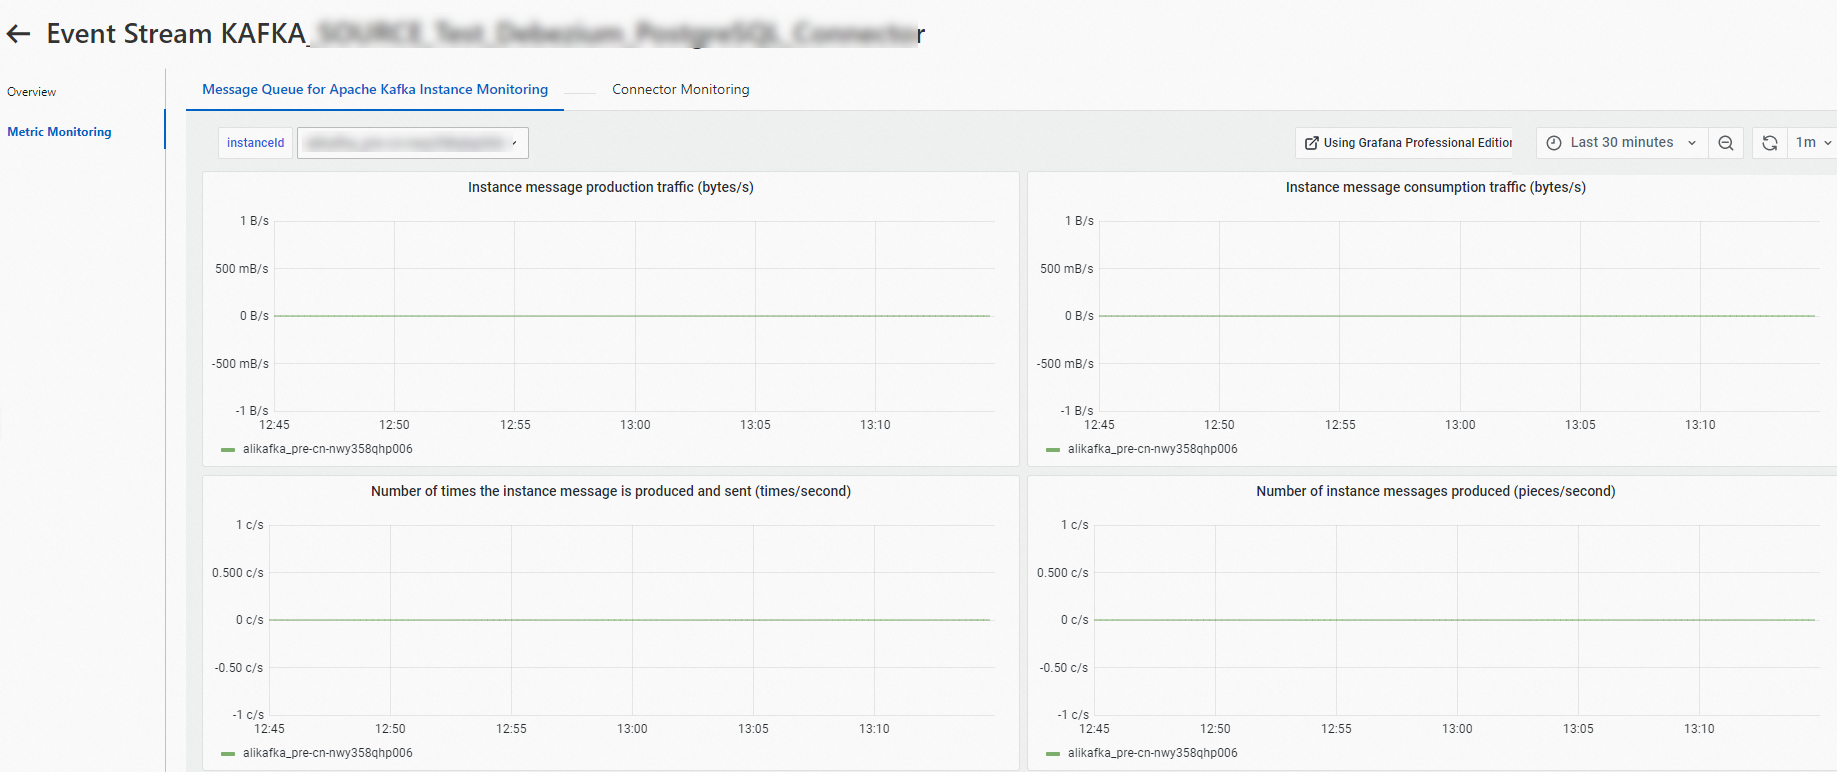
Click the Message Queue for Apache Kafka Instance Monitoring tab to view metrics for each Message Queue for Apache Kafka instance connected to the event stream.
Worker monitoring
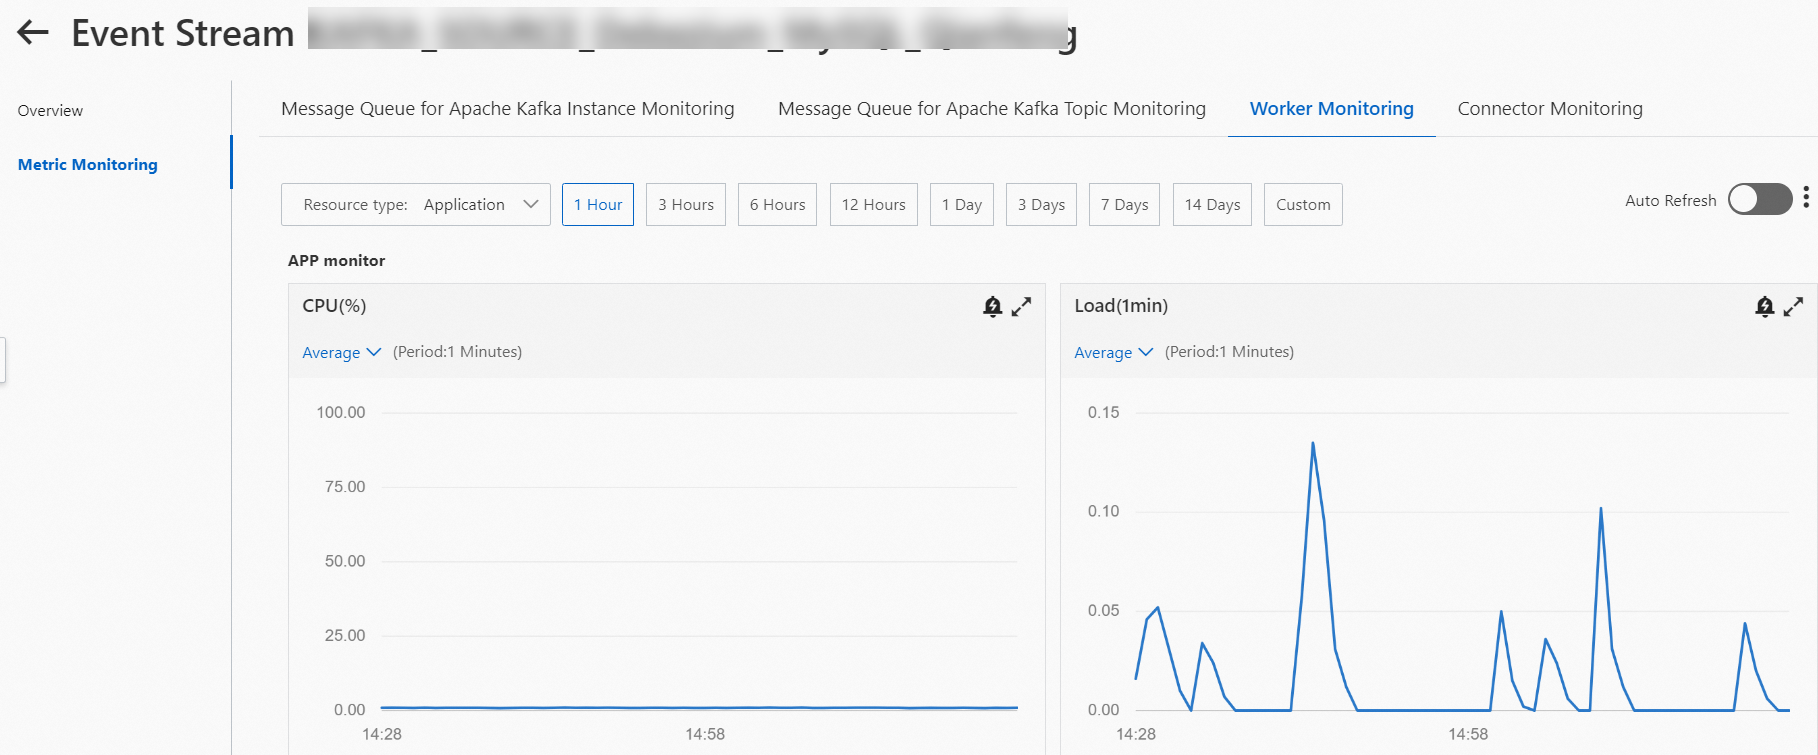
Click the Worker Monitoring tab to view resource consumption for each SAE application and instance.
Connector monitoring
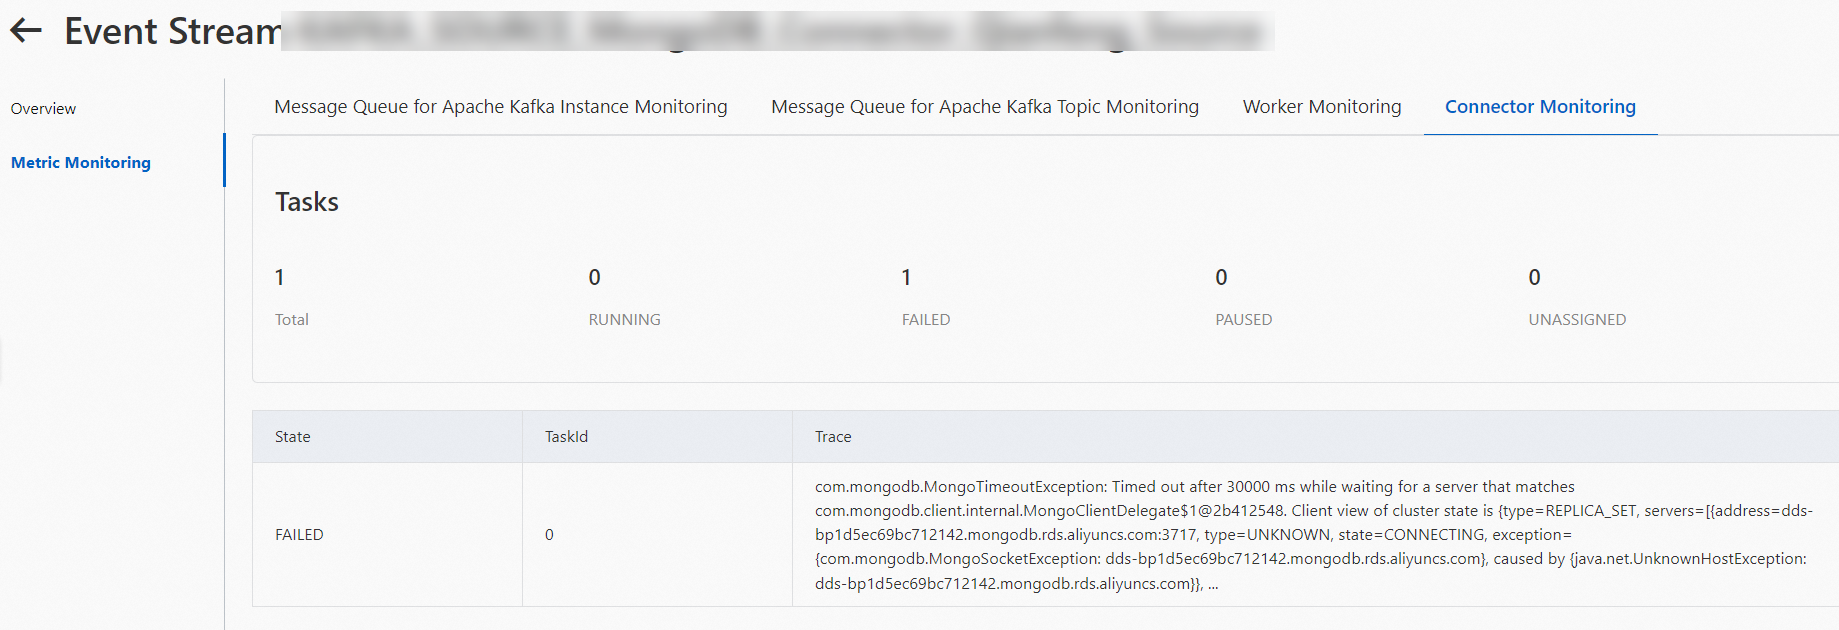
Click the Connector Monitoring tab to view the running status of Kafka Connect tasks. When a task fails, this tab shows the failure details.
Troubleshoot connector failures
If a Kafka connector stops running, follow the escalation path below to identify and resolve the issue. Start from the Event Stream Details page: navigate to Event Streams in the EventBridge console, then click Details for the target connector.
Step 1: Check the error details
On the Event Stream Details page, click Overview in the left-side navigation pane.
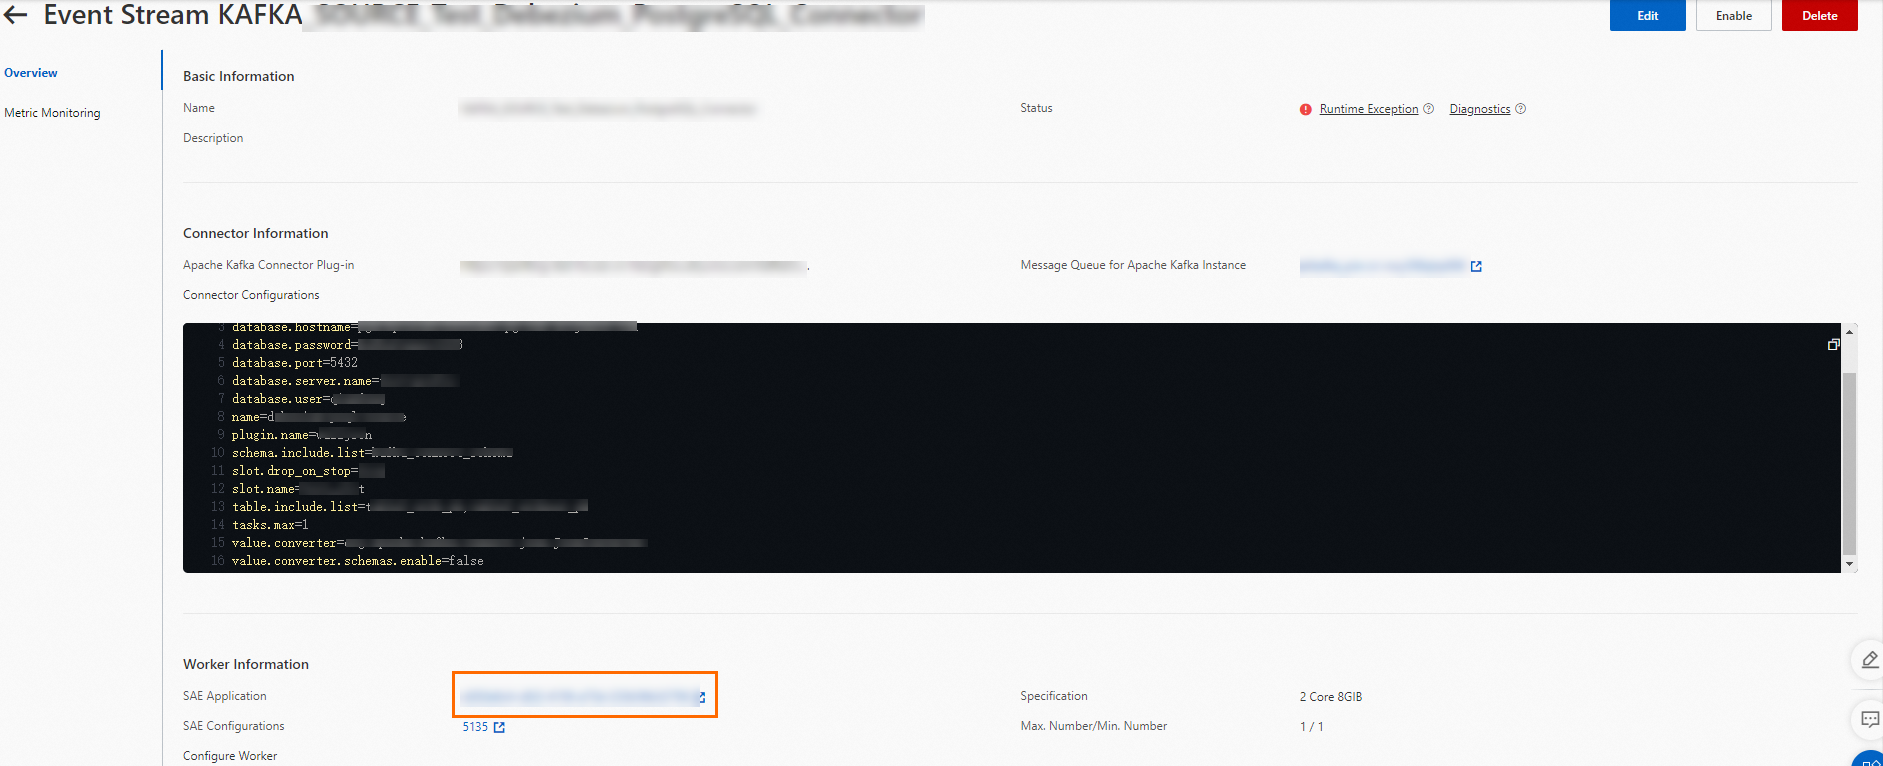
In the Basic Information section, click Running Exception to view the error type and detailed error information.

If the error is caused by a Kafka Connect task failure, click Diagnostics to go to the Connector Monitoring page for task-level failure details.
Step 2: Access connector logs in the SAE console
If the error details from Step 1 do not resolve the issue, access the Kafka Connect runtime environment through the SAE console to inspect the logs directly.
On the Event Stream Details page, click Overview in the left-side navigation pane.
In the Worker Information section, click the instance name next to SAE Application to open the Application Details page in the SAE console.
On the Basic Information page, click the Instance Deployment Information tab.
In the Actions column, click Webshell to open a terminal session in the Kafka Connect runtime environment.

In the terminal, check the connector running logs at the following path:
/opt/kafka/logs/connect.log