When Dynatrace detects infrastructure or application problems, you need those alerts to trigger automated responses across your cloud environment. EventBridge connects to Dynatrace through a webhook-based integration: Dynatrace sends problem notifications as HTTP POST requests to an EventBridge custom event bus, where event rules filter, transform, and route them to downstream targets such as Function Compute, Message Queue, or DingTalk.
Use cases
Centralized alert management: Aggregate Dynatrace alerts alongside alerts from other monitoring tools into a single event bus for unified visibility
Automated incident response: Trigger a Function Compute function to restart services, scale resources, or run remediation runbooks when Dynatrace detects a problem
Tiered alert routing: Forward critical Dynatrace alerts to DingTalk or SMS while logging lower-priority alerts to Log Service
How it works
Create an HTTP event source on a custom event bus in EventBridge. EventBridge generates a public webhook URL for this event source.
Configure a problem notification in Dynatrace with the webhook URL. Dynatrace sends an HTTP POST request to this URL whenever it detects a problem.
EventBridge receives the POST request as an event on the custom event bus. Event rules route or transform these events to downstream targets.
Prerequisites
Before you begin, ensure that you have:
An activated EventBridge service with appropriate RAM permissions. See Activate EventBridge and grant permissions to a RAM user
A custom event bus. See Create a custom event bus
A Dynatrace account. See Register a Dynatrace account
Step 1: Create an HTTP event source in EventBridge
Create an event source that receives webhook requests from Dynatrace.
Log on to the EventBridge console.
In the top navigation bar, select a region.
Create a custom event source of the HTTP/HTTPS Events type with the following settings. For detailed instructions, see Create a custom event source of the HTTP/HTTPS Events type.
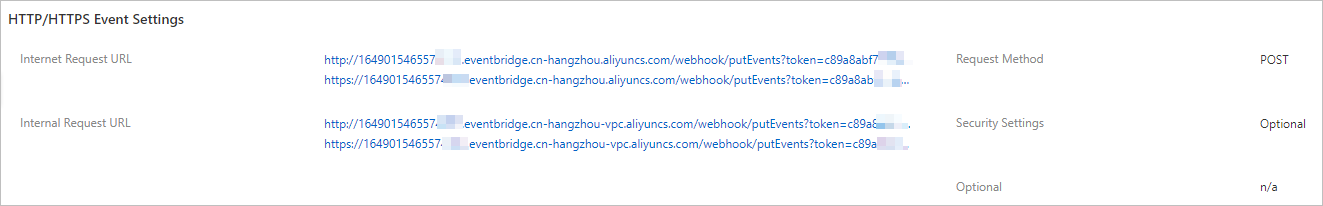
Parameter Value Request Type HTTP & HTTPS Request Method POST Security Configuration Optional After the event source is created, go to the Event Sources page. Click Details in the Operations column to view the event source details.
Copy the Internet request URL. This is the webhook URL that Dynatrace sends notifications to.
Step 2: Configure problem notifications in Dynatrace
Set up a webhook in Dynatrace to forward problem alerts to EventBridge.
Log on to the Dynatrace console.
In the left-side navigation pane, choose Settings > Integration > Problem notifications.
Click Add notifications.
Configure the following parameters:
Parameter Description Display name A name for this notification setting, such as EventBridge-IntegrationWebhook URL The Internet request URL copied from Step 1 Click Save.
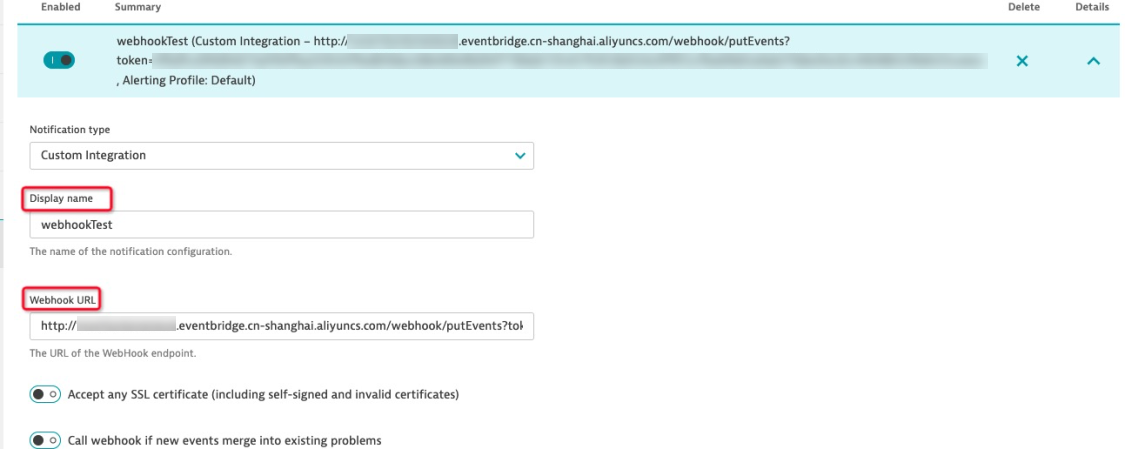
Dynatrace also supports optional settings such as custom HTTP headers, alerting profiles to control which problems trigger notifications, and a secret URL toggle that hides the webhook endpoint. Adjust these settings for your production environment as needed. For details, see Dynatrace webhook integration.
Step 3: Send a test notification
Verify that Dynatrace can deliver events to EventBridge.
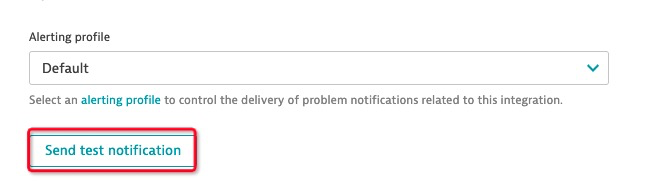
In the Dynatrace console, go to Settings > Integration > Problem notifications.
Open the notification setting you configured in Step 2.
Click Send test notification.
Dynatrace sends a test event with the following payload structure:
{
  "ImpactedEntities": [
    {
      "type": "SERVICE",
      "name": "MyService1",
      "entity": "SERVICE-XXXXXXXXXXXXX"
    }
  ],
  "ImpactedEntity": "MyHost1, MyService1",
  "PID": "99999",
  "ProblemID": "999",
  "ProblemImpact": "INFRASTRUCTURE",
  "ProblemTitle": "Dynatrace problem notification test run",
  "State": "OPEN"
}
Key fields in the payload:
| Field | Description |
|---|---|
ProblemTitle | Summary of the detected problem |
ProblemID | Unique identifier for the problem |
ProblemImpact | Impact category: APPLICATION, SERVICE, or INFRASTRUCTURE |
State | Problem state: OPEN or RESOLVED |
ImpactedEntities | List of affected entities with type, name, and entity ID |
Dynatrace supports customizable webhook payloads with placeholders such as {ProblemTitle} and {State}. For details, see Dynatrace webhook integration.
Step 4: Verify events in EventBridge
Confirm that EventBridge received the test event.
Log on to the EventBridge console.
In the top navigation bar, select the same region as your custom event bus.
In the left-side navigation pane, click Event Buses.
Click Event Tracking to view the received events.
If the test event appears in the event list, the integration is working correctly.
What's next
After the integration is verified, create event rules to process Dynatrace events:
Create an event rule -- Filter Dynatrace events by fields such as
ProblemImpactorStateand route them to specific targetsCreate an event target -- Connect targets such as Function Compute, Message Queue, or HTTP endpoints for automated incident response