CloudMonitor lets you define alert rules that monitor specific Logstash cluster metrics and notify your team when those metrics exceed configured thresholds. This topic describes how to create a custom combined-metric alert rule for a Logstash cluster and verify that alerts are delivered correctly.
Complete the following tasks before configuring the alert policy:
- Ensure you have access to the Alibaba Cloud Elasticsearch console and CloudMonitor.
- Create an alert contact group in CloudMonitor. Alert notifications are sent to all contacts in this group. For instructions, see Create an alert contact or alert contact group.
Procedure
-
Configure the Alert Scope.
In the Create Alert Rule panel, set the following parameters to target your Logstash cluster:
Parameter
Value
Product
Select Logstash from the drop-down list.
Resource Range
Select Instances.
Associated Resources
Select the Logstash cluster.
Note: For parameters not listed in this table, retain the default values. For a full parameter reference, see Create an alert rule.
-
Configure the Alert Rule.
-
In the Rule Description area, click Add Rule and select Combined Metrics.
The Configure Rule Description panel opens.
-
In the Alert Rule field, enter a descriptive name for this rule.
-
Configure the following parameters:
Parameter
Value
Metric Type
Select Combined Metrics.
Alert Level
Select Warning (Warn) from the drop-down list.
Multi-metric Alert Condition
Specify multiple metrics.
Relationship Between Metrics
Select Generate alerts if one of the conditions is met (||).
Alert Threshold Triggers
Select 3 Consecutive Cycles (1 Cycle = 1 Minutes).
-
Click Confirm to save the rule description and return to the Create Alert Rule panel.
-
-
Set Up Alert Notifications.
-
In the Alert Contact Group field, select the alert contact group you created. CloudMonitor sends notifications to all contacts in the selected group when the alert fires.
-
(Optional) To receive alert notifications at a custom endpoint, click Advanced Settings and enter a publicly accessible URL in the Alert Callback field. CloudMonitor pushes notifications to this URL through a POST request. Only HTTP requests are supported. For setup details, see Use the alert callback feature to send notifications about threshold-triggered alerts.
-
Click Confirm to save the alert rule.
-
-
Verify the Configuration.
After saving the alert rule, verify that monitoring is active and notifications are configured correctly.
-
In the CloudMonitor console, confirm that the new alert rule appears in the alert rules list with the correct cluster association.
-
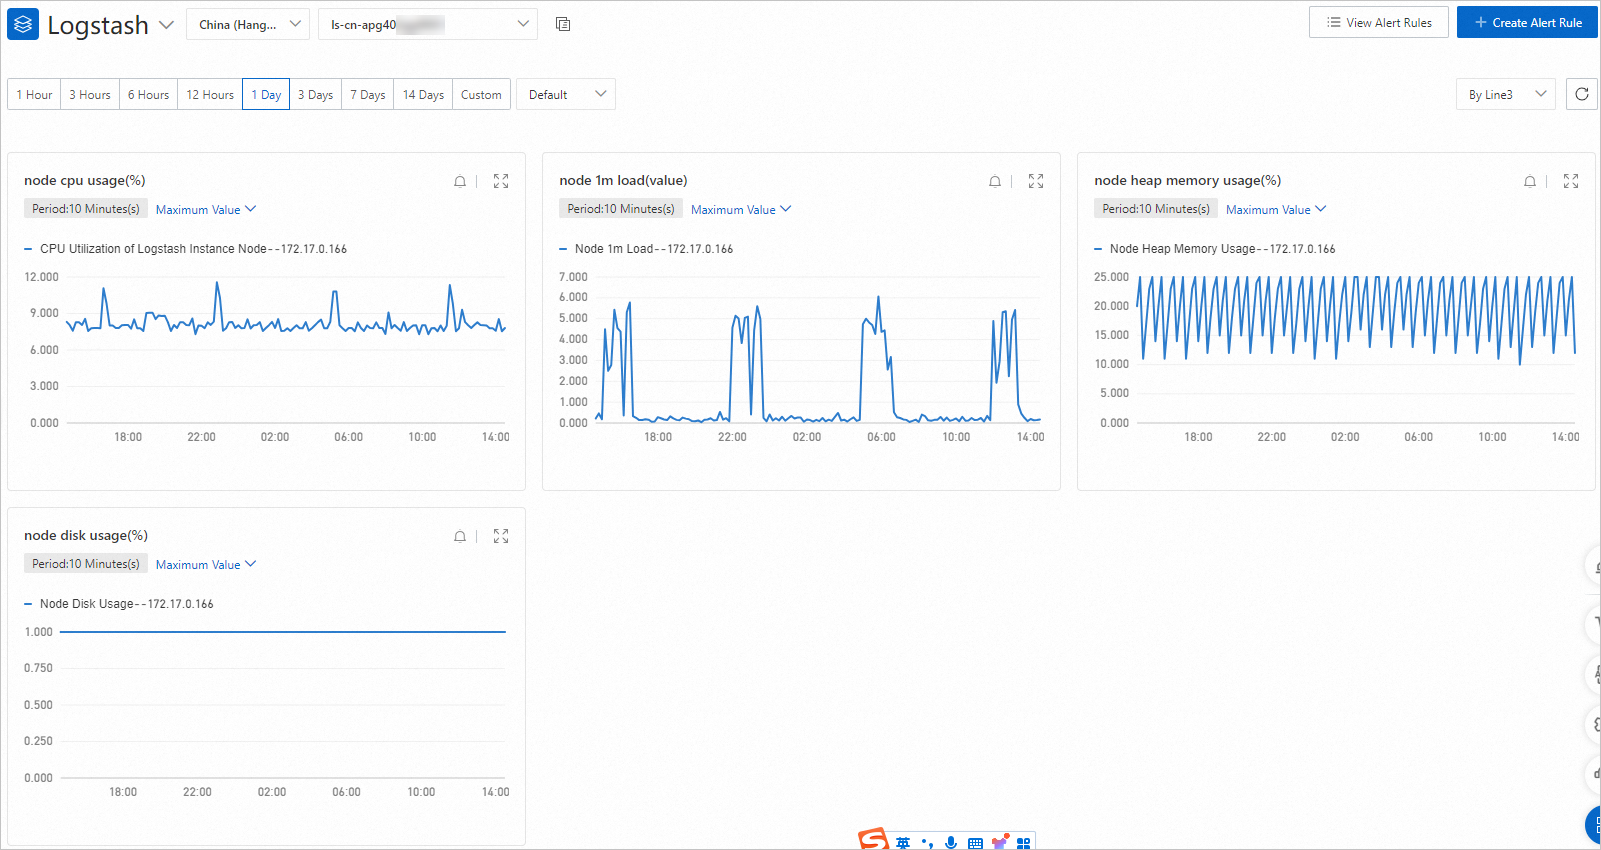
To view Logstash cluster metrics, navigate to the dashboard:
-
In the left-side navigation pane, choose .
-
In the upper-right corner, select Logstash from the drop-down list and select the region where the Logstash cluster resides.
-
Select the Logstash cluster from the instance drop-down list and specify a time range to view the monitoring data of the cluster.
-
Note: After the configuration is complete and the Logstash cluster enters a normal state, the system starts to monitor the cluster and displays monitoring data on the dashboard. When a metric exceeds its configured threshold for three consecutive cycles, CloudMonitor sends a notification to the alert contact group and, if configured, calls the alert callback URL.
-