Cluster load imbalance occurs when some nodes handle significantly more traffic than others, causing slow queries, indexing delays, or node failures. This topic covers the four main causes of load imbalance on an Alibaba Cloud Elasticsearch cluster and how to resolve each one.
Symptoms
Load imbalance typically appears in two ways:
Disk usage is roughly even across nodes, but CPU utilization or load_1m spikes on specific nodes.
Disk usage varies significantly across nodes, and CPU utilization or load_1m confirms the imbalance.
Causes
By likelihood:
Inappropriate shard allocation — the most common cause. Check this first.
Uneven segment sizes — large segments on a single shard slow down queries on that shard.
Unseparated hot and cold data — routing queries to specific nodes concentrates load.
Uneven persistent connections — rare; affects multi-zone deployments using Server Load Balancer (SLB).
If none of these causes apply, contact Alibaba Cloud technical support.
Inappropriate shard allocation
Scenario
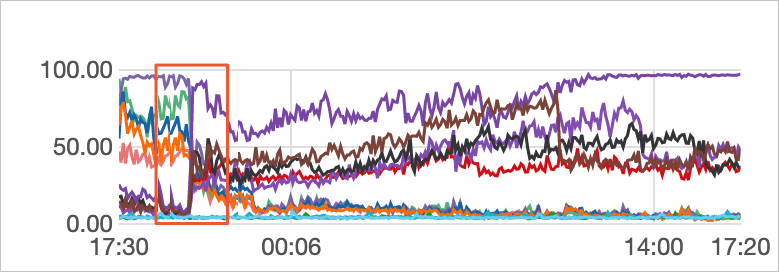
A cluster has 3 dedicated master nodes and 9 data nodes. Master nodes: 16 vCPUs, 32 GiB memory. Data nodes: 32 vCPUs, 64 GiB memory. During peak hours (16:21–18:00), the cluster handles ~2,000 read QPS and 1,000 write QPS. CPU utilization on two nodes reaches 100%, degrading query performance.
Analysis
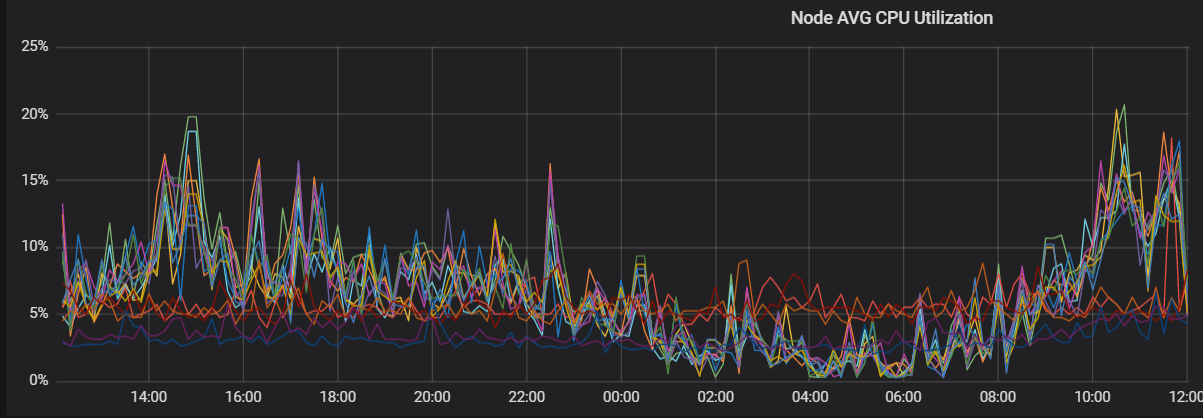
Check Elastic Compute Service (ECS) instances and network monitoring. During peak hours, query QPS spikes and CPU utilization rises sharply on the affected nodes. This confirms the high-load nodes are processing most query traffic.
Run `GET _cat/shards?v` to check shard distribution. The output shows shards from the
testindex are concentrated on the high-load nodes. Disk usage on those nodes is also higher. Uneven shard allocation causes uneven storage, and nodes with more data handle more read and write traffic.Run `GET _cat/indices?v` to check index configuration. The
testindex has 5 primary shards and 1 replica per primary. Shards are not evenly distributed, and some documents are marked.del. When Elasticsearch searches, it scans.del-marked documents and filters them out — extra work that reduces search efficiency. Run force merge during off-peak hours to remove these documents.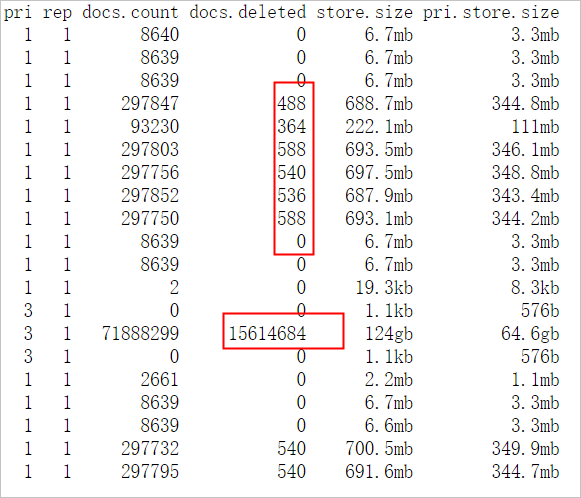
Review cluster logs and slow logs. All queries are normal term queries with no errors in cluster logs. The root cause is shard distribution, not query-level issues.
Root cause
Uneven shard allocation concentrates storage and traffic on a subset of nodes, causing CPU imbalance.
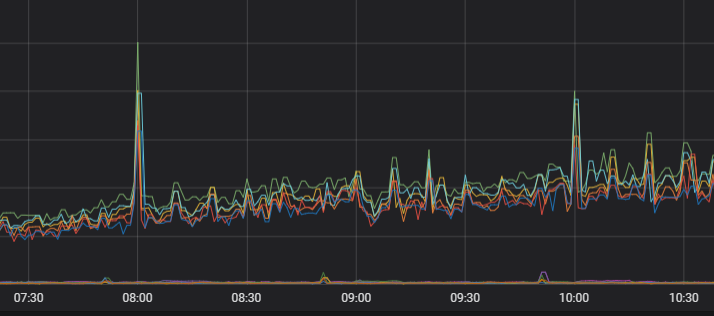
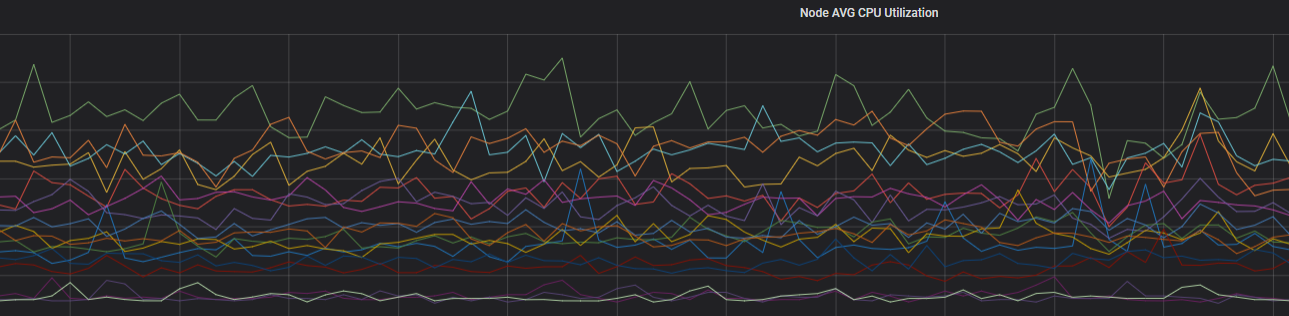
After rebalancing shards, CPU utilization evens out across nodes:
Solution
Plan shard counts before creating indexes. See Shard planning guidelines below.
Shard planning guidelines
The number and size of shards determine cluster stability and performance. Use these guidelines when planning shards for each index.
In Elasticsearch versions earlier than 7.x, the default is 5 primary shards with 1 replica per primary. In 7.x and later, the default is 1 primary shard with 1 replica.
| Constraint | Guideline |
|---|---|
| Shard size (low-spec nodes) | 30 GB per shard maximum |
| Shard size (high-spec nodes) | 50 GB per shard maximum |
| Shard size (log analytics or very large indexes) | 100 GB per shard maximum |
| Total shards per cluster | Total primary + replica shards must equal or be a multiple of the number of data nodes |
| Shards per node | Memory size (GiB) x 30 — exceeding this risks file handle exhaustion |
| Shards per index per node | 5 shards maximum |
The more primary shards you configure, the higher the performance overhead on the cluster.
If you have enabled the Auto Indexing feature, use the scenario-based configuration template to adjust shard settings and keep shards evenly distributed.
Uneven segment sizes
Scenario
One node in the cluster experiences a sudden spike in CPU utilization, affecting query performance. The test index has 3 primary shards and 1 replica per primary, evenly distributed across nodes. The index contains many documents marked delete.doc. ECS instances are confirmed normal.
Analysis
Add `"profile": true` to the query body. The profiling output shows Shard 1 of the
testindex takes longer to query than the other shards.Run queries with `preference=_primary` and `preference=_replica`, both with
"profile": true. The primary shard of Shard 1 is slower than its replica. This isolates Shard 1 as the cause.Run the following commands to inspect Shard 1's segments:
Document count differences between a primary shard and its replica can occur for two reasons: - Sync latency: If documents are being written continuously, the replica may temporarily lag behind. Once writes stop, counts converge. - Auto-generated document IDs with concurrent deletes: If you write documents using auto-generated IDs and send a Delete by Query request for a document that was just written, the delete runs on the primary shard before the write propagates to the replica. The replica then receives the write without the delete, resulting in more documents on the replica. Additionally, the primary accumulates documents marked
doc.delete.GET _cat/segments/index?v&h=shard,segment,size,size.memory,ip GET _cat/shards?vThe output shows Shard 1 has larger segments and more documents than its replica shard. The segment size difference is causing the load imbalance.
Solution (choose one)
During off-peak hours, call force merge to compact small segments and remove
delete.docdocuments.Restart the node hosting the primary shard. This promotes the replica to primary and generates a new replica from it, giving both shards identical segment structures.
After optimization, load evens out across nodes:
Uneven persistent connections
This cause is rare and specific to multi-zone deployments.
Scenario
A cluster is deployed across two zones: Zone B and Zone C. Zone C nodes consistently carry higher loads than Zone B nodes. The imbalance is not caused by hardware differences or uneven data distribution.
Analysis
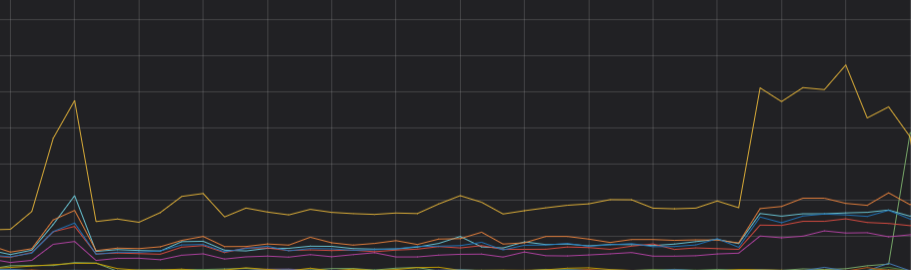
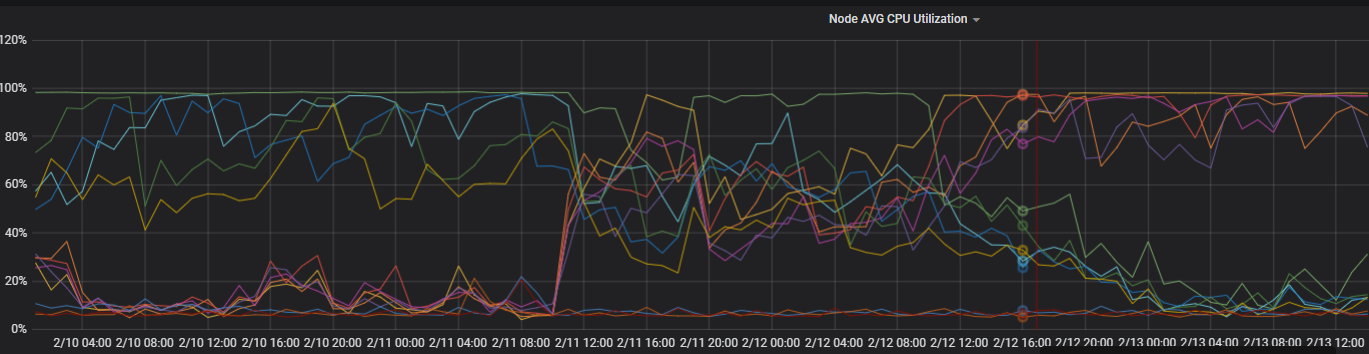
View CPU utilization over the last 4 days. The monitoring data shows CPU utilization shifted significantly at a specific point in time.
Check TCP connections on each node. The number of TCP connections differs significantly between Zone B and Zone C, pointing to a network connection distribution issue.
Check client connection behavior. The client uses persistent connections and creates few new connections. In multi-zone architectures, each scheduling unit independently selects the optimal node when establishing a connection. When new connection volume is low, multiple scheduling units may pick the same node. Additionally, Elasticsearch client nodes prefer forwarding requests to nodes in the same zone, which concentrates traffic on one zone.
Solution (choose one)
Set a connection time-to-live on the client. Use
httpClientBuilder.setConnectionTimeToLive()to force periodic connection renewal. For example, to set a 5-minute TTL:Use
setConnectionTimeToLive()for this purpose.setKeepAliveStrategy()is less effective at redistributing connections.httpClientBuilder.setConnectionTimeToLive(5, TimeUnit.MINUTES)For details, see HttpAsyncClientBuilder.
Restart clients concurrently to force new connections across all nodes simultaneously.
Use dedicated client nodes to route traffic. Client nodes forward requests to data nodes, isolating the routing layer from the storage layer. Even if client nodes become heavily loaded, data nodes are not affected.
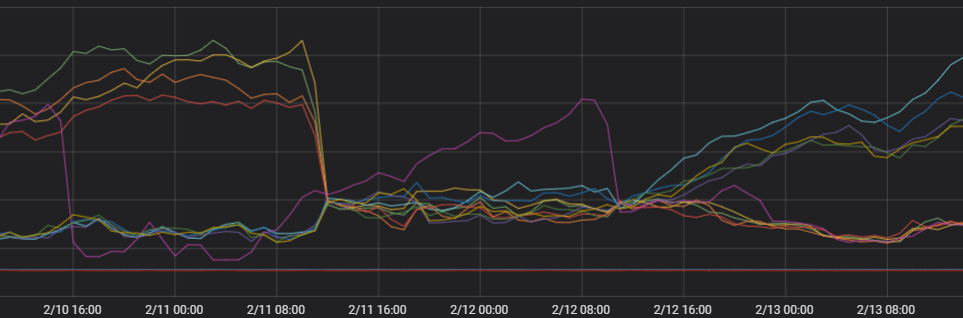
After optimization, load distributes evenly across zones:
Uneven shards for a single index
Scenario
Shards appear evenly distributed across nodes, but a specific index has more shards — or larger shards — on the high-load nodes.
Solution
Set index.routing.allocation.total_shards_per_node to cap the number of shards from a single index that can land on any one node.
Calculate the value as: (primary shards + replica shards) / number of data nodes. Round up if the result is not a whole number.
PUT index_name/_settings
{
  "index.routing.allocation.total_shards_per_node": "3"
}