This page compares benchmark results between two Alibaba Cloud Elasticsearch V8.9.1 clusters — one using Intel CPUs and one using AMD CPUs — using Rally, the official Elasticsearch benchmarking tool.
All tests use the http_logs dataset, a write-heavy workload. Results reflect indexing-intensive scenarios. Performance differences in search-heavy workloads may vary.Test configurations
| Item | Description |
|---|---|
| Cluster configurations | Version: 8.9.1; CPU type: Intel and AMD; Data node specifications: 4 vCPUs and 16 GiB of memory; Storage type of data nodes: Enhanced SSD (ESSD); Storage performance level of data nodes: PL1; Storage space per data node: 200 GiB; Number of data nodes: 3 |
| Rally configurations | Default Rally tracks |
| Dataset | Built-in dataset http_logs of Rally, with 258,610,096 documents. Get the dataset from Elasticsearch Rally Hub. |
| Number of shards | Primary shards: 6; Replica shards: 0 |
| bulk_size | 2,000 documents submitted each time |
| bulk_indexing_clients | 10 clients used in parallel |
Test results
These results are for reference only. Run stress tests with your own production data before making instance selection decisions.
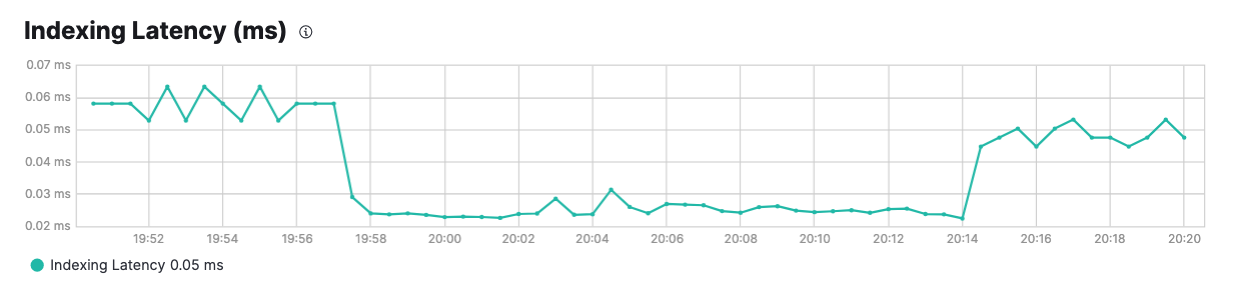
Main metrics for the Intel cluster
| Indexing rate | Indexing latency |
|---|---|
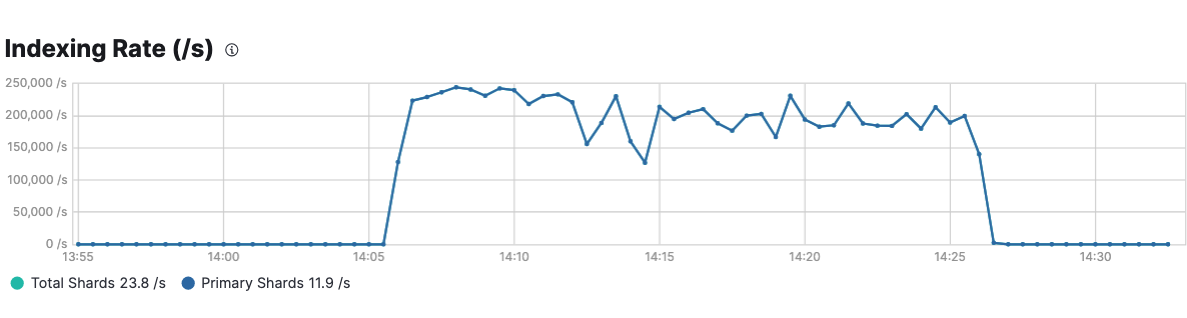 | 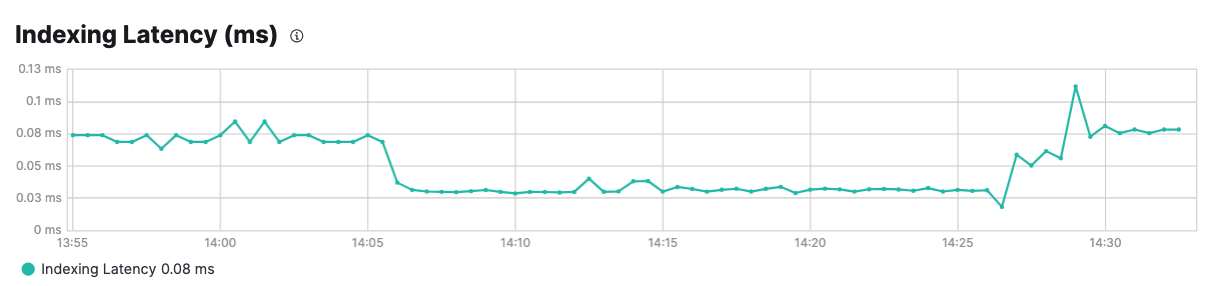 |
| Average CPU utilization of nodes | Load of each node within 1 minute |
|---|---|
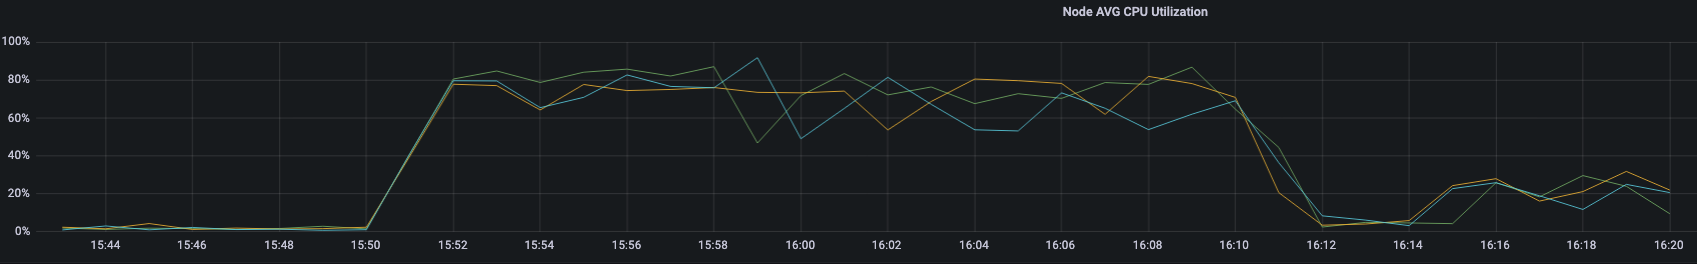 |  |
Main metrics for the AMD cluster
| Indexing rate | Indexing latency |
|---|---|
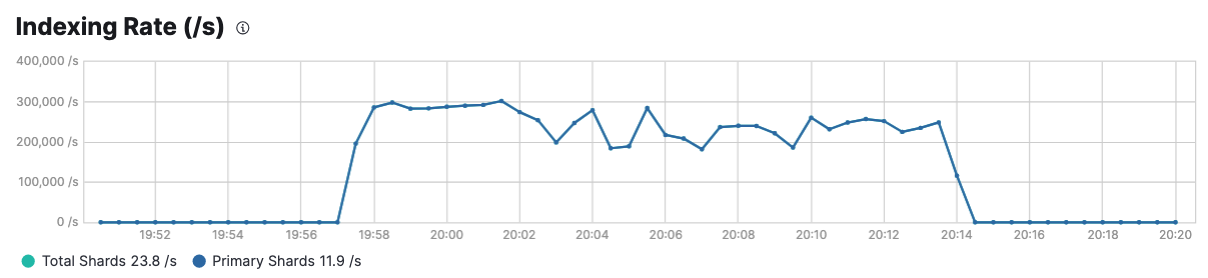 |  |
| Average CPU utilization of nodes | Load of each node within 1 minute |
|---|---|
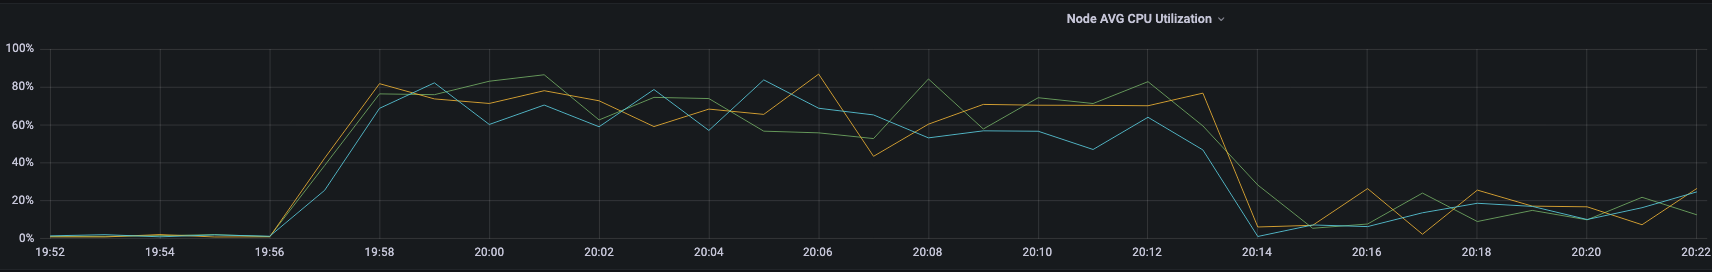 | 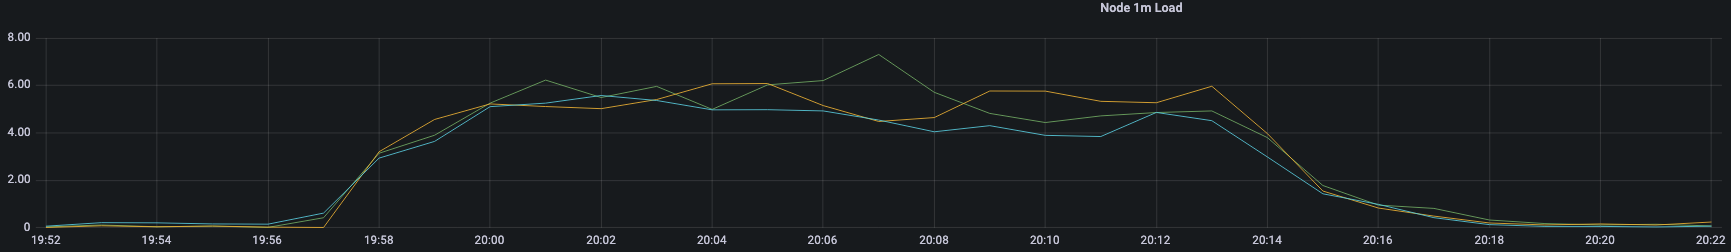 |
How to read the test report
The test report compares the two clusters across all Rally tasks:
Baseline: Intel cluster
Contender: AMD cluster
Diff: Contender value minus Baseline value
Diff %: Percentage change from Baseline to Contender
For latency and service time metrics, a negative Diff % means the AMD cluster is faster (lower latency is better). For throughput metrics, a positive Diff % means the AMD cluster has higher throughput.
For a full description of each metric, see Overview.
Test report
| Metric | Task | Baseline | Contender | Diff | Unit | Diff % |
|---|---|---|---|---|---|---|
| Cumulative indexing time of primary shards | - | 129.703 | 102.055 | -27.6478 | min | -21.32% |
| Min cumulative indexing time across primary shard | - | 0 | 0 | 0 | min | 0.00% |
| Median cumulative indexing time across primary shard | - | 0.857517 | 0.696508 | -0.16101 | min | -18.78% |
| Max cumulative indexing time across primary shard | - | 16.5645 | 13.3361 | -3.22845 | min | -19.49% |
| Cumulative indexing throttle time of primary shards | - | 0 | 0 | 0 | min | 0.00% |
| Min cumulative indexing throttle time across primary shard | - | 0 | 0 | 0 | min | 0.00% |
| Median cumulative indexing throttle time across primary shard | - | 0 | 0 | 0 | min | 0.00% |
| Max cumulative indexing throttle time across primary shard | - | 0 | 0 | 0 | min | 0.00% |
| Cumulative merge time of primary shards | - | 50.4829 | 39.6667 | -10.8162 | min | -21.43% |
| Cumulative merge count of primary shards | - | 601 | 707 | 106 | - | 17.64% |
| Min cumulative merge time across primary shard | - | 0 | 0 | 0 | min | 0.00% |
| Median cumulative merge time across primary shard | - | 0.081167 | 0.060108 | -0.02106 | min | -25.94% |
| Max cumulative merge time across primary shard | - | 9.88038 | 7.27312 | -2.60727 | min | -26.39% |
| Cumulative merge throttle time of primary shards | - | 15.6503 | 14.0385 | -1.61183 | min | -10.30% |
| Min cumulative merge throttle time across primary shard | - | 0 | 0 | 0 | min | 0.00% |
| Median cumulative merge throttle time across primary shard | - | 0 | 0 | 0 | min | 0.00% |
| Max cumulative merge throttle time across primary shard | - | 4.30382 | 2.70368 | -1.60013 | min | -37.18% |
| Cumulative refresh time of primary shards | - | 17.8214 | 13.9168 | -3.90465 | min | -21.91% |
| Cumulative refresh count of primary shards | - | 6140 | 7059 | 919 | - | 14.97% |
| Min cumulative refresh time across primary shard | - | 0 | 0 | 0 | min | 0.00% |
| Median cumulative refresh time across primary shard | - | 0.119483 | 0.095608 | -0.02388 | min | -19.98% |
| Max cumulative refresh time across primary shard | - | 2.15253 | 1.8133 | -0.33923 | min | -15.76% |
| Cumulative flush time of primary shards | - | 3.80468 | 2.96465 | -0.84003 | min | -22.08% |
| Cumulative flush count of primary shards | - | 817 | 935 | 118 | - | 14.44% |
| Min cumulative flush time across primary shard | - | 3.33E-05 | 3.33E-05 | 0 | min | 0.00% |
| Median cumulative flush time across primary shard | - | 0.016117 | 0.009042 | -0.00707 | min | -43.90% |
| Max cumulative flush time across primary shard | - | 0.5159 | 0.412433 | -0.10347 | min | -20.06% |
| Total Young Gen GC time | - | 17.58 | 13.059 | -4.521 | s | -25.72% |
| Total Young Gen GC count | - | 922 | 927 | 5 | - | 0.54% |
| Total Old Gen GC time | - | 0 | 0 | 0 | s | 0.00% |
| Total Old Gen GC count | - | 0 | 0 | 0 | - | 0.00% |
| Store size | - | 18.1059 | 18.0849 | -0.02105 | GB | -0.12% |
| Translog size | - | 0.000209 | 0.00061 | 0.0004 | GB | 192.31% |
| Heap used for segments | - | 0 | 0 | 0 | MB | 0.00% |
| Heap used for doc values | - | 0 | 0 | 0 | MB | 0.00% |
| Heap used for terms | - | 0 | 0 | 0 | MB | 0.00% |
| Heap used for norms | - | 0 | 0 | 0 | MB | 0.00% |
| Heap used for points | - | 0 | 0 | 0 | MB | 0.00% |
| Heap used for stored fields | - | 0 | 0 | 0 | MB | 0.00% |
| Segment count | - | 56 | 56 | 0 | - | 0.00% |
| Total Ingest Pipeline count | - | 0 | 0 | 0 | - | 0.00% |
| Total Ingest Pipeline time | - | 0 | 0 | 0 | ms | 0.00% |
| Total Ingest Pipeline failed | - | 0 | 0 | 0 | - | 0.00% |
| Min Throughput | index-append | 207170 | 246927 | 39757.2 | docs/s | 19.19% |
| Mean Throughput | index-append | 219531 | 259191 | 39659.6 | docs/s | 18.07% |
| Median Throughput | index-append | 217484 | 253231 | 35747.1 | docs/s | 16.44% |
| Max Throughput | index-append | 238529 | 285152 | 46623.5 | docs/s | 19.55% |
| 50th percentile latency | index-append | 80.1159 | 65.6737 | -14.4423 | ms | -18.03% |
| 90th percentile latency | index-append | 123.321 | 107.964 | -15.3569 | ms | -12.45% |
| 99th percentile latency | index-append | 394.778 | 370.36 | -24.4179 | ms | -6.19% |
| 99.9th percentile latency | index-append | 2125.09 | 1858.68 | -266.414 | ms | -12.54% |
| 99.99th percentile latency | index-append | 2816.56 | 2466.99 | -349.566 | ms | -12.41% |
| 100th percentile latency | index-append | 3341.14 | 3130.68 | -210.46 | ms | -6.30% |
| 50th percentile service time | index-append | 80.1159 | 65.6737 | -14.4423 | ms | -18.03% |
| 90th percentile service time | index-append | 123.321 | 107.964 | -15.3569 | ms | -12.45% |
| 99th percentile service time | index-append | 394.778 | 370.36 | -24.4179 | ms | -6.19% |
| 99.9th percentile service time | index-append | 2125.09 | 1858.68 | -266.414 | ms | -12.54% |
| 99.99th percentile service time | index-append | 2816.56 | 2466.99 | -349.566 | ms | -12.41% |
| 100th percentile service time | index-append | 3341.14 | 3130.68 | -210.46 | ms | -6.30% |
| error rate | index-append | 0 | 0 | 0 | % | 0.00% |
| Min Throughput | default | 19.9543 | 20.0136 | 0.05937 | ops/s | 0.30% |
| Mean Throughput | default | 19.9645 | 20.0148 | 0.05031 | ops/s | 0.25% |
| Median Throughput | default | 19.9661 | 20.0146 | 0.04852 | ops/s | 0.24% |
| Max Throughput | default | 19.9692 | 20.0163 | 0.04712 | ops/s | 0.24% |
| 50th percentile latency | default | 6.14099 | 6.97574 | 0.83475 | ms | 13.59% |
| 90th percentile latency | default | 7.43625 | 13.9997 | 6.56347 | ms | 88.26% |
| 99th percentile latency | default | 35.009 | 19.807 | -15.202 | ms | -43.42% |
| 100th percentile latency | default | 73.9764 | 26.398 | -47.5784 | ms | -64.32% |
| 50th percentile service time | default | 4.93161 | 5.78914 | 0.85754 | ms | 17.39% |
| 90th percentile service time | default | 6.18375 | 12.9478 | 6.76402 | ms | 109.38% |
| 99th percentile service time | default | 25.6137 | 18.1302 | -7.48351 | ms | -29.22% |
| 100th percentile service time | default | 73.0867 | 25.6559 | -47.4308 | ms | -64.90% |
| error rate | default | 0 | 0 | 0 | % | 0.00% |
| Min Throughput | term | 42.1405 | 45.54 | 3.39951 | ops/s | 8.07% |
| Mean Throughput | term | 42.4414 | 45.7123 | 3.27082 | ops/s | 7.71% |
| Median Throughput | term | 42.4414 | 45.7123 | 3.27082 | ops/s | 7.71% |
| Max Throughput | term | 42.7424 | 45.8845 | 3.14212 | ops/s | 7.35% |
| 50th percentile latency | term | 8.54857 | 8.72683 | 0.17826 | ms | 2.09% |
| 90th percentile latency | term | 10.4358 | 17.0515 | 6.61568 | ms | 63.39% |
| 99th percentile latency | term | 12.6224 | 18.6216 | 5.99919 | ms | 47.53% |
| 100th percentile latency | term | 22.1556 | 18.9202 | -3.23542 | ms | -14.60% |
| 50th percentile service time | term | 7.13231 | 7.69349 | 0.56117 | ms | 7.87% |
| 90th percentile service time | term | 8.7835 | 16.1963 | 7.41283 | ms | 84.39% |
| 99th percentile service time | term | 11.7613 | 17.6558 | 5.89451 | ms | 50.12% |
| 100th percentile service time | term | 20.9707 | 17.988 | -2.98269 | ms | -14.22% |
| error rate | term | 0 | 0 | 0 | % | 0.00% |
| Min Throughput | terms_enum | 50.0042 | 49.9622 | -0.04206 | ops/s | -0.08% |
| Mean Throughput | terms_enum | 50.0061 | 49.9646 | -0.04147 | ops/s | -0.08% |
| Median Throughput | terms_enum | 50.0061 | 49.9646 | -0.04147 | ops/s | -0.08% |
| Max Throughput | terms_enum | 50.0079 | 49.967 | -0.04088 | ops/s | -0.08% |
| 50th percentile latency | terms_enum | 5.98002 | 5.38995 | -0.59008 | ms | -9.87% |
| 90th percentile latency | terms_enum | 8.03784 | 6.1311 | -1.90675 | ms | -23.72% |
| 99th percentile latency | terms_enum | 9.48662 | 6.69081 | -2.79581 | ms | -29.47% |
| 100th percentile latency | terms_enum | 11.5759 | 6.98172 | -4.59415 | ms | -39.69% |
| 50th percentile service time | terms_enum | 4.95221 | 4.34496 | -0.60725 | ms | -12.26% |
| 90th percentile service time | terms_enum | 6.8323 | 5.09056 | -1.74175 | ms | -25.49% |
| 99th percentile service time | terms_enum | 8.43886 | 5.7731 | -2.66575 | ms | -31.59% |
| 100th percentile service time | terms_enum | 11.0347 | 5.81366 | -5.22108 | ms | -47.31% |
| error rate | terms_enum | 0 | 0 | 0 | % | 0.00% |
| Min Throughput | range | 24.8781 | 24.8419 | -0.03624 | ops/s | -0.15% |
| Mean Throughput | range | 24.9019 | 24.8743 | -0.02755 | ops/s | -0.11% |
| Median Throughput | range | 24.9036 | 24.8771 | -0.02645 | ops/s | -0.11% |
| Max Throughput | range | 24.9222 | 24.9011 | -0.02106 | ops/s | -0.08% |
| 50th percentile latency | range | 8.53625 | 11.5534 | 3.01715 | ms | 35.35% |
| 90th percentile latency | range | 10.119 | 16.3788 | 6.25977 | ms | 61.86% |
| 99th percentile latency | range | 87.6618 | 61.8365 | -25.8253 | ms | -29.46% |
| 100th percentile latency | range | 111.375 | 91.01 | -20.3653 | ms | -18.29% |
| 50th percentile service time | range | 7.46765 | 9.83658 | 2.36892 | ms | 31.72% |
| 90th percentile service time | range | 9.07516 | 15.151 | 6.07585 | ms | 66.95% |
| 99th percentile service time | range | 29.1409 | 25.4798 | -3.66106 | ms | -12.56% |
| 100th percentile service time | range | 110.444 | 90.2189 | -20.2251 | ms | -18.31% |
| error rate | range | 0 | 0 | 0 | % | 0.00% |
| Min Throughput | 200s-in-range | 25.0189 | 25.0147 | -0.00421 | ops/s | -0.02% |
| Mean Throughput | 200s-in-range | 25.0209 | 25.0157 | -0.00523 | ops/s | -0.02% |
| Median Throughput | 200s-in-range | 25.021 | 25.0158 | -0.00522 | ops/s | -0.02% |
| Max Throughput | 200s-in-range | 25.0228 | 25.0165 | -0.00628 | ops/s | -0.03% |
| 50th percentile latency | 200s-in-range | 6.58007 | 6.96683 | 0.38676 | ms | 5.88% |
| 90th percentile latency | 200s-in-range | 7.31511 | 14.2176 | 6.90247 | ms | 94.36% |
| 99th percentile latency | 200s-in-range | 13.0505 | 16.2106 | 3.16013 | ms | 24.21% |
| 100th percentile latency | 200s-in-range | 14.214 | 16.7579 | 2.54389 | ms | 17.90% |
| 50th percentile service time | 200s-in-range | 5.47809 | 5.74641 | 0.26832 | ms | 4.90% |
| 90th percentile service time | 200s-in-range | 6.12861 | 13.1191 | 6.99051 | ms | 114.06% |
| 99th percentile service time | 200s-in-range | 11.7787 | 15.0305 | 3.25172 | ms | 27.61% |
| 100th percentile service time | 200s-in-range | 12.7718 | 15.2718 | 2.49999 | ms | 19.57% |
| error rate | 200s-in-range | 0 | 0 | 0 | % | 0.00% |
| Min Throughput | 400s-in-range | 49.2768 | 49.8465 | 0.56972 | ops/s | 1.16% |
| Mean Throughput | 400s-in-range | 49.5872 | 49.8527 | 0.2655 | ops/s | 0.54% |
| Median Throughput | 400s-in-range | 49.5872 | 49.8527 | 0.2655 | ops/s | 0.54% |
| Max Throughput | 400s-in-range | 49.8976 | 49.8589 | -0.03871 | ops/s | -0.08% |
| 50th percentile latency | 400s-in-range | 5.87218 | 5.63856 | -0.23363 | ms | -3.98% |
| 90th percentile latency | 400s-in-range | 107.373 | 14.6019 | -92.7709 | ms | -86.40% |
| 99th percentile latency | 400s-in-range | 165.168 | 15.2894 | -149.878 | ms | -90.74% |
| 100th percentile latency | 400s-in-range | 167.499 | 15.3018 | -152.197 | ms | -90.86% |
| 50th percentile service time | 400s-in-range | 4.84777 | 4.33927 | -0.50849 | ms | -10.49% |
| 90th percentile service time | 400s-in-range | 9.54248 | 13.7726 | 4.23015 | ms | 44.33% |
| 99th percentile service time | 400s-in-range | 36.7794 | 14.1992 | -22.5803 | ms | -61.39% |
| 100th percentile service time | 400s-in-range | 154.091 | 14.4398 | -139.652 | ms | -90.63% |
| error rate | 400s-in-range | 0 | 0 | 0 | % | 0.00% |
| Min Throughput | hourly_agg | 0.200569 | 0.200643 | 7.00E-05 | ops/s | 0.04% |
| Mean Throughput | hourly_agg | 0.200786 | 0.200889 | 0.0001 | ops/s | 0.05% |
| Median Throughput | hourly_agg | 0.200756 | 0.200855 | 0.0001 | ops/s | 0.05% |
| Max Throughput | hourly_agg | 0.201128 | 0.201276 | 0.00015 | ops/s | 0.07% |
| 50th percentile latency | hourly_agg | 1924.92 | 1208.75 | -716.177 | ms | -37.21% |
| 90th percentile latency | hourly_agg | 2009.28 | 1295.78 | -713.5 | ms | -35.51% |
| 99th percentile latency | hourly_agg | 2118.9 | 1373.95 | -744.948 | ms | -35.16% |
| 100th percentile latency | hourly_agg | 2302.15 | 1412.59 | -889.561 | ms | -38.64% |
| 50th percentile service time | hourly_agg | 1921.89 | 1207.03 | -714.863 | ms | -37.20% |
| 90th percentile service time | hourly_agg | 2007.78 | 1293.08 | -714.704 | ms | -35.60% |
| 99th percentile service time | hourly_agg | 2116.37 | 1371.75 | -744.62 | ms | -35.18% |
| 100th percentile service time | hourly_agg | 2300.89 | 1410.87 | -890.025 | ms | -38.68% |
| error rate | hourly_agg | 0 | 0 | 0 | % | 0.00% |
| Min Throughput | scroll | 25.0461 | 25.0346 | -0.01149 | pages/s | -0.05% |
| Mean Throughput | scroll | 25.076 | 25.057 | -0.01896 | pages/s | -0.08% |
| Median Throughput | scroll | 25.0691 | 25.0519 | -0.01726 | pages/s | -0.07% |
| Max Throughput | scroll | 25.1378 | 25.1034 | -0.0344 | pages/s | -0.14% |
| 50th percentile latency | scroll | 355.086 | 284.214 | -70.8712 | ms | -19.96% |
| 90th percentile latency | scroll | 373.589 | 320.074 | -53.5147 | ms | -14.32% |
| 99th percentile latency | scroll | 407.765 | 392.236 | -15.5299 | ms | -3.81% |
| 100th percentile latency | scroll | 443.031 | 424.419 | -18.6123 | ms | -4.20% |
| 50th percentile service time | scroll | 353.174 | 282.065 | -71.109 | ms | -20.13% |
| 90th percentile service time | scroll | 371.193 | 317.671 | -53.5224 | ms | -14.42% |
| 99th percentile service time | scroll | 405.43 | 390.441 | -14.9888 | ms | -3.70% |
| 100th percentile service time | scroll | 440.533 | 422.39 | -18.1429 | ms | -4.12% |
| error rate | scroll | 0 | 0 | 0 | % | 0.00% |
| Min Throughput | desc_sort_timestamp | 2.00614 | 2.00289 | -0.00325 | ops/s | -0.16% |
| Mean Throughput | desc_sort_timestamp | 2.00744 | 2.00351 | -0.00393 | ops/s | -0.20% |
| Median Throughput | desc_sort_timestamp | 2.00733 | 2.00347 | -0.00386 | ops/s | -0.19% |
| Max Throughput | desc_sort_timestamp | 2.00914 | 2.00431 | -0.00482 | ops/s | -0.24% |
| 50th percentile latency | desc_sort_timestamp | 33.0101 | 28.9762 | -4.03395 | ms | -12.22% |
| 90th percentile latency | desc_sort_timestamp | 36.9596 | 33.5568 | -3.40286 | ms | -9.21% |
| 99th percentile latency | desc_sort_timestamp | 58.5063 | 48.5754 | -9.93091 | ms | -16.97% |
| 100th percentile latency | desc_sort_timestamp | 58.978 | 54.4266 | -4.55139 | ms | -7.72% |
| 50th percentile service time | desc_sort_timestamp | 31.3791 | 27.084 | -4.29514 | ms | -13.69% |
| 90th percentile service time | desc_sort_timestamp | 35.3589 | 31.7176 | -3.64125 | ms | -10.30% |
| 99th percentile service time | desc_sort_timestamp | 57.1305 | 45.9329 | -11.1975 | ms | -19.60% |
| 100th percentile service time | desc_sort_timestamp | 57.783 | 52.3953 | -5.38767 | ms | -9.32% |
| error rate | desc_sort_timestamp | 0 | 0 | 0 | % | 0.00% |
| Min Throughput | asc_sort_timestamp | 19.9902 | 19.9995 | 0.00929 | ops/s | 0.05% |
| Mean Throughput | asc_sort_timestamp | 19.9922 | 20.0002 | 0.00802 | ops/s | 0.04% |
| Median Throughput | asc_sort_timestamp | 19.9925 | 20.0002 | 0.00777 | ops/s | 0.04% |
| Max Throughput | asc_sort_timestamp | 19.9934 | 20.0007 | 0.0073 | ops/s | 0.04% |
| 50th percentile latency | asc_sort_timestamp | 11.2175 | 10.6533 | -0.56418 | ms | -5.03% |
| 90th percentile latency | asc_sort_timestamp | 14.8594 | 19.1131 | 4.25376 | ms | 28.63% |
| 99th percentile latency | asc_sort_timestamp | 21.2579 | 41.1673 | 19.9094 | ms | 93.66% |
| 100th percentile latency | asc_sort_timestamp | 21.2697 | 70.2215 | 48.9518 | ms | 230.15% |
| 50th percentile service time | asc_sort_timestamp | 10.3341 | 9.53094 | -0.80321 | ms | -7.77% |
| 90th percentile service time | asc_sort_timestamp | 13.5502 | 17.4792 | 3.92903 | ms | 29.00% |
| 99th percentile service time | asc_sort_timestamp | 20.1624 | 40.4308 | 20.2684 | ms | 100.53% |
| 100th percentile service time | asc_sort_timestamp | 20.5719 | 69.3565 | 48.7846 | ms | 237.14% |
| error rate | asc_sort_timestamp | 0 | 0 | 0 | % | 0.00% |
| Min Throughput | desc_sort_with_after_timestamp | 1.00376 | 1.00698 | 0.00321 | ops/s | 0.32% |
| Mean Throughput | desc_sort_with_after_timestamp | 1.00984 | 1.01846 | 0.00862 | ops/s | 0.85% |
| Median Throughput | desc_sort_with_after_timestamp | 1.00686 | 1.01275 | 0.00589 | ops/s | 0.59% |
| Max Throughput | desc_sort_with_after_timestamp | 1.03882 | 1.07444 | 0.03562 | ops/s | 3.43% |
| 50th percentile latency | desc_sort_with_after_timestamp | 585.964 | 46.577 | -539.387 | ms | -92.05% |
| 90th percentile latency | desc_sort_with_after_timestamp | 616.699 | 56.7421 | -559.957 | ms | -90.80% |
| 99th percentile latency | desc_sort_with_after_timestamp | 658.428 | 80.96 | -577.469 | ms | -87.70% |
| 100th percentile latency | desc_sort_with_after_timestamp | 675.078 | 116.245 | -558.832 | ms | -82.78% |
| 50th percentile service time | desc_sort_with_after_timestamp | 584.084 | 43.6989 | -540.385 | ms | -92.52% |
| 90th percentile service time | desc_sort_with_after_timestamp | 615.507 | 53.8327 | -561.674 | ms | -91.25% |
| 99th percentile service time | desc_sort_with_after_timestamp | 657.173 | 78.0997 | -579.074 | ms | -88.12% |
| 100th percentile service time | desc_sort_with_after_timestamp | 673.631 | 115.487 | -558.143 | ms | -82.86% |
| error rate | desc_sort_with_after_timestamp | 0 | 0 | 0 | % | 0.00% |
| Min Throughput | asc_sort_with_after_timestamp | 0.504309 | 0.504301 | ###### | ops/s | 0.00% |
| Mean Throughput | asc_sort_with_after_timestamp | 0.511463 | 0.51144 | ###### | ops/s | 0.00% |
| Median Throughput | asc_sort_with_after_timestamp | 0.507895 | 0.507875 | ###### | ops/s | 0.00% |
| Max Throughput | asc_sort_with_after_timestamp | 0.54673 | 0.546633 | -0.0001 | ops/s | -0.02% |
| 50th percentile latency | asc_sort_with_after_timestamp | 14.9573 | 31.9896 | 17.0323 | ms | 113.87% |
| 90th percentile latency | asc_sort_with_after_timestamp | 16.8667 | 36.3939 | 19.5272 | ms | 115.77% |
| 99th percentile latency | asc_sort_with_after_timestamp | 21.4881 | 41.9769 | 20.4887 | ms | 95.35% |
| 100th percentile latency | asc_sort_with_after_timestamp | 29.497 | 75.5642 | 46.0672 | ms | 156.18% |
| 50th percentile service time | asc_sort_with_after_timestamp | 11.9017 | 29.2771 | 17.3754 | ms | 145.99% |
| 90th percentile service time | asc_sort_with_after_timestamp | 14.1056 | 33.5124 | 19.4067 | ms | 137.58% |
| 99th percentile service time | asc_sort_with_after_timestamp | 18.8203 | 39.4603 | 20.64 | ms | 109.67% |
| 100th percentile service time | asc_sort_with_after_timestamp | 27.1084 | 73.8293 | 46.721 | ms | 172.35% |
| error rate | asc_sort_with_after_timestamp | 0 | 0 | 0 | % | 0.00% |
| Min Throughput | desc_sort_timestamp_can_match_shortcut | 2.00496 | 2.00536 | 0.0004 | ops/s | 0.02% |
| Mean Throughput | desc_sort_timestamp_can_match_shortcut | 2.00602 | 2.00649 | 0.00047 | ops/s | 0.02% |
| Median Throughput | desc_sort_timestamp_can_match_shortcut | 2.00594 | 2.0064 | 0.00046 | ops/s | 0.02% |
| Max Throughput | desc_sort_timestamp_can_match_shortcut | 2.0074 | 2.00796 | 0.00056 | ops/s | 0.03% |
| 50th percentile latency | desc_sort_timestamp_can_match_shortcut | 37.3768 | 30.7569 | -6.61986 | ms | -17.71% |
| 90th percentile latency | desc_sort_timestamp_can_match_shortcut | 40.8894 | 35.2822 | -5.60728 | ms | -13.71% |
| 99th percentile latency | desc_sort_timestamp_can_match_shortcut | 53.2476 | 39.6154 | -13.6321 | ms | -25.60% |
| 100th percentile latency | desc_sort_timestamp_can_match_shortcut | 81.5778 | 49.8105 | -31.7673 | ms | -38.94% |
| 50th percentile service time | desc_sort_timestamp_can_match_shortcut | 35.942 | 29.3074 | -6.63464 | ms | -18.46% |
| 90th percentile service time | desc_sort_timestamp_can_match_shortcut | 39.7756 | 33.4821 | -6.29352 | ms | -15.82% |
| 99th percentile service time | desc_sort_timestamp_can_match_shortcut | 51.8262 | 38.6499 | -13.1763 | ms | -25.42% |
| 100th percentile service time | desc_sort_timestamp_can_match_shortcut | 80.1559 | 48.8295 | -31.3265 | ms | -39.08% |
| error rate | desc_sort_timestamp_can_match_shortcut | 0 | 0 | 0 | % | 0.00% |
| Min Throughput | desc_sort_timestamp_no_can_match_shortcut | 2.0058 | 2.006 | 0.00021 | ops/s | 0.01% |
| Mean Throughput | desc_sort_timestamp_no_can_match_shortcut | 2.00703 | 2.00728 | 0.00025 | ops/s | 0.01% |
| Median Throughput | desc_sort_timestamp_no_can_match_shortcut | 2.00693 | 2.00718 | 0.00025 | ops/s | 0.01% |
| Max Throughput | desc_sort_timestamp_no_can_match_shortcut | 2.00864 | 2.00894 | 0.0003 | ops/s | 0.01% |
| 50th percentile latency | desc_sort_timestamp_no_can_match_shortcut | 47.6447 | 43.8025 | -3.84224 | ms | -8.06% |
| 90th percentile latency | desc_sort_timestamp_no_can_match_shortcut | 50.1462 | 48.2184 | -1.92778 | ms | -3.84% |
| 99th percentile latency | desc_sort_timestamp_no_can_match_shortcut | 63.3456 | 71.8562 | 8.51065 | ms | 13.44% |
| 100th percentile latency | desc_sort_timestamp_no_can_match_shortcut | 68.4468 | 217.645 | 149.198 | ms | 217.98% |
| 50th percentile service time | desc_sort_timestamp_no_can_match_shortcut | 46.1795 | 42.0692 | -4.11028 | ms | -8.90% |
| 90th percentile service time | desc_sort_timestamp_no_can_match_shortcut | 48.3907 | 46.8669 | -1.52383 | ms | -3.15% |
| 99th percentile service time | desc_sort_timestamp_no_can_match_shortcut | 61.9762 | 70.398 | 8.42183 | ms | 13.59% |
| 100th percentile service time | desc_sort_timestamp_no_can_match_shortcut | 66.3827 | 216.083 | 149.7 | ms | 225.51% |
| error rate | desc_sort_timestamp_no_can_match_shortcut | 0 | 0 | 0 | % | 0.00% |
| Min Throughput | sort_keyword_can_match_shortcut | 2.00655 | 2.00592 | -0.00062 | ops/s | -0.03% |
| Mean Throughput | sort_keyword_can_match_shortcut | 2.00793 | 2.00719 | -0.00074 | ops/s | -0.04% |
| Median Throughput | sort_keyword_can_match_shortcut | 2.00783 | 2.0071 | -0.00073 | ops/s | -0.04% |
| Max Throughput | sort_keyword_can_match_shortcut | 2.00975 | 2.00883 | -0.00092 | ops/s | -0.05% |
| 50th percentile latency | sort_keyword_can_match_shortcut | 11.2726 | 9.85176 | -1.42084 | ms | -12.60% |
| 90th percentile latency | sort_keyword_can_match_shortcut | 12.2857 | 16.2932 | 4.00753 | ms | 32.62% |
| 99th percentile latency | sort_keyword_can_match_shortcut | 13.6317 | 18.1372 | 4.50557 | ms | 33.05% |
| 100th percentile latency | sort_keyword_can_match_shortcut | 13.9129 | 26.3997 | 12.4868 | ms | 89.75% |
| 50th percentile service time | sort_keyword_can_match_shortcut | 9.69712 | 8.18183 | -1.51529 | ms | -15.63% |
| 90th percentile service time | sort_keyword_can_match_shortcut | 10.7475 | 14.6557 | 3.90818 | ms | 36.36% |
| 99th percentile service time | sort_keyword_can_match_shortcut | 11.9499 | 15.9737 | 4.02376 | ms | 33.67% |
| 100th percentile service time | sort_keyword_can_match_shortcut | 12.4481 | 16.5509 | 4.10273 | ms | 32.96% |
| error rate | sort_keyword_can_match_shortcut | 0 | 0 | 0 | % | 0.00% |
| Min Throughput | sort_keyword_no_can_match_shortcut | 2.00656 | 2.00656 | 0 | ops/s | 0.00% |
| Mean Throughput | sort_keyword_no_can_match_shortcut | 2.00796 | 2.00797 | 1.00E-05 | ops/s | 0.00% |
| Median Throughput | sort_keyword_no_can_match_shortcut | 2.00785 | 2.00785 | 0 | ops/s | 0.00% |
| Max Throughput | sort_keyword_no_can_match_shortcut | 2.00978 | 2.00977 | 0 | ops/s | 0.00% |
| 50th percentile latency | sort_keyword_no_can_match_shortcut | 9.78064 | 15.0156 | 5.23493 | ms | 53.52% |
| 90th percentile latency | sort_keyword_no_can_match_shortcut | 10.7862 | 17.1041 | 6.31788 | ms | 58.57% |
| 99th percentile latency | sort_keyword_no_can_match_shortcut | 12.436 | 19.0266 | 6.59057 | ms | 53.00% |
| 100th percentile latency | sort_keyword_no_can_match_shortcut | 16.6298 | 26.8356 | 10.2058 | ms | 61.37% |
| 50th percentile service time | sort_keyword_no_can_match_shortcut | 8.18368 | 13.5125 | 5.32886 | ms | 65.12% |
| 90th percentile service time | sort_keyword_no_can_match_shortcut | 9.25296 | 15.2897 | 6.03674 | ms | 65.24% |
| 99th percentile service time | sort_keyword_no_can_match_shortcut | 10.9936 | 17.1686 | 6.17504 | ms | 56.17% |
| 100th percentile service time | sort_keyword_no_can_match_shortcut | 15.1334 | 24.7287 | 9.59537 | ms | 63.41% |
| error rate | sort_keyword_no_can_match_shortcut | 0 | 0 | 0 | % | 0.00% |
| Min Throughput | sort_numeric_can_match_shortcut | 0.963674 | 1.22449 | 0.26082 | ops/s | 27.07% |
| Mean Throughput | sort_numeric_can_match_shortcut | 0.966441 | 1.22673 | 0.26029 | ops/s | 26.93% |
| Median Throughput | sort_numeric_can_match_shortcut | 0.96634 | 1.22648 | 0.26014 | ops/s | 26.92% |
| Max Throughput | sort_numeric_can_match_shortcut | 0.96916 | 1.22864 | 0.25948 | ops/s | 26.77% |
| 50th percentile latency | sort_numeric_can_match_shortcut | 134537 | 79712.8 | -54824.2 | ms | -40.75% |
| 90th percentile latency | sort_numeric_can_match_shortcut | 155131 | 92107.5 | -63023.5 | ms | -40.63% |
| 99th percentile latency | sort_numeric_can_match_shortcut | 159715 | 94716.4 | -64998.6 | ms | -40.70% |
| 100th percentile latency | sort_numeric_can_match_shortcut | 160208 | 95022.5 | -65185.8 | ms | -40.69% |
| 50th percentile service time | sort_numeric_can_match_shortcut | 1004.01 | 806.799 | -197.207 | ms | -19.64% |
| 90th percentile service time | sort_numeric_can_match_shortcut | 1101.34 | 873.658 | -227.686 | ms | -20.67% |
| 99th percentile service time | sort_numeric_can_match_shortcut | 1254.52 | 998.126 | -256.398 | ms | -20.44% |
| 100th percentile service time | sort_numeric_can_match_shortcut | 1380.32 | 1027.2 | -353.12 | ms | -25.58% |
| error rate | sort_numeric_can_match_shortcut | 0 | 0 | 0 | % | 0.00% |
| Min Throughput | sort_numeric_no_can_match_shortcut | 0.966762 | 1.22813 | 0.26137 | ops/s | 27.04% |
| Mean Throughput | sort_numeric_no_can_match_shortcut | 0.969163 | 1.22932 | 0.26016 | ops/s | 26.84% |
| Median Throughput | sort_numeric_no_can_match_shortcut | 0.969242 | 1.22931 | 0.26007 | ops/s | 26.83% |
| Max Throughput | sort_numeric_no_can_match_shortcut | 0.9713 | 1.23048 | 0.25918 | ops/s | 26.68% |
| 50th percentile latency | sort_numeric_no_can_match_shortcut | 133640 | 79019.5 | -54620.8 | ms | -40.87% |
| 90th percentile latency | sort_numeric_no_can_match_shortcut | 155138 | 91318.8 | -63818.7 | ms | -41.14% |
| 99th percentile latency | sort_numeric_no_can_match_shortcut | 159603 | 94019.2 | -65583.7 | ms | -41.09% |
| 100th percentile latency | sort_numeric_no_can_match_shortcut | 160232 | 94326.6 | -65905.4 | ms | -41.13% |
| 50th percentile service time | sort_numeric_no_can_match_shortcut | 1005.74 | 804.518 | -201.218 | ms | -20.01% |
| 90th percentile service time | sort_numeric_no_can_match_shortcut | 1169.51 | 852.46 | -317.046 | ms | -27.11% |
| 99th percentile service time | sort_numeric_no_can_match_shortcut | 1339.2 | 927.433 | -411.764 | ms | -30.75% |
| 100th percentile service time | sort_numeric_no_can_match_shortcut | 1406.59 | 991.307 | -415.281 | ms | -29.52% |
| error rate | sort_numeric_no_can_match_shortcut | 0 | 0 | 0 | % | 0.00% |
| Min Throughput | desc-sort-timestamp-after-force-merge-1-seg | 1.00229 | 1.00201 | -0.00027 | ops/s | -0.03% |
| Mean Throughput | desc-sort-timestamp-after-force-merge-1-seg | 1.00277 | 1.00244 | -0.00033 | ops/s | -0.03% |
| Median Throughput | desc-sort-timestamp-after-force-merge-1-seg | 1.00274 | 1.00241 | -0.00033 | ops/s | -0.03% |
| Max Throughput | desc-sort-timestamp-after-force-merge-1-seg | 1.00341 | 1.00301 | -0.00041 | ops/s | -0.04% |
| 50th percentile latency | desc-sort-timestamp-after-force-merge-1-seg | 260.097 | 183.978 | -76.1191 | ms | -29.27% |
| 90th percentile latency | desc-sort-timestamp-after-force-merge-1-seg | 284.032 | 196.703 | -87.3291 | ms | -30.75% |
| 99th percentile latency | desc-sort-timestamp-after-force-merge-1-seg | 306.384 | 211.325 | -95.0592 | ms | -31.03% |
| 100th percentile latency | desc-sort-timestamp-after-force-merge-1-seg | 353.419 | 268.131 | -85.2881 | ms | -24.13% |
| 50th percentile service time | desc-sort-timestamp-after-force-merge-1-seg | 258.32 | 181.683 | -76.6371 | ms | -29.67% |
| 90th percentile service time | desc-sort-timestamp-after-force-merge-1-seg | 283.151 | 194.379 | -88.7724 | ms | -31.35% |
| 99th percentile service time | desc-sort-timestamp-after-force-merge-1-seg | 304.338 | 208.029 | -96.3091 | ms | -31.65% |
| 100th percentile service time | desc-sort-timestamp-after-force-merge-1-seg | 351.788 | 266.45 | -85.3375 | ms | -24.26% |
| error rate | desc-sort-timestamp-after-force-merge-1-seg | 0 | 0 | 0 | % | 0.00% |
| Min Throughput | asc-sort-timestamp-after-force-merge-1-seg | 44.8357 | 49.2481 | 4.41233 | ops/s | 9.84% |
| Mean Throughput | asc-sort-timestamp-after-force-merge-1-seg | 45.2654 | 49.3137 | 4.04823 | ops/s | 8.94% |
| Median Throughput | asc-sort-timestamp-after-force-merge-1-seg | 45.2654 | 49.3137 | 4.04823 | ops/s | 8.94% |
| Max Throughput | asc-sort-timestamp-after-force-merge-1-seg | 45.6952 | 49.3793 | 3.68414 | ops/s | 8.06% |
| 50th percentile latency | asc-sort-timestamp-after-force-merge-1-seg | 10.0604 | 18.8289 | 8.76855 | ms | 87.16% |
| 90th percentile latency | asc-sort-timestamp-after-force-merge-1-seg | 12.623 | 25.2324 | 12.6094 | ms | 99.89% |
| 99th percentile latency | asc-sort-timestamp-after-force-merge-1-seg | 15.9647 | 32.4808 | 16.5161 | ms | 103.45% |
| 100th percentile latency | asc-sort-timestamp-after-force-merge-1-seg | 16.4214 | 33.0725 | 16.651 | ms | 101.40% |
| 50th percentile service time | asc-sort-timestamp-after-force-merge-1-seg | 8.78168 | 17.6916 | 8.90992 | ms | 101.46% |
| 90th percentile service time | asc-sort-timestamp-after-force-merge-1-seg | 11.2994 | 22.5581 | 11.2587 | ms | 99.64% |
| 99th percentile service time | asc-sort-timestamp-after-force-merge-1-seg | 14.7302 | 25.7189 | 10.9887 | ms | 74.60% |
| 100th percentile service time | asc-sort-timestamp-after-force-merge-1-seg | 15.193 | 26.532 | 11.339 | ms | 74.63% |
| error rate | asc-sort-timestamp-after-force-merge-1-seg | 0 | 0 | 0 | % | 0.00% |
| Min Throughput | desc-sort-with-after-timestamp-after-force-merge-1-seg | 1.00266 | 1.00411 | 0.00145 | ops/s | 0.14% |
| Mean Throughput | desc-sort-with-after-timestamp-after-force-merge-1-seg | 1.00695 | 1.01076 | 0.00381 | ops/s | 0.38% |
| Median Throughput | desc-sort-with-after-timestamp-after-force-merge-1-seg | 1.00485 | 1.00749 | 0.00264 | ops/s | 0.26% |
| Max Throughput | desc-sort-with-after-timestamp-after-force-merge-1-seg | 1.0273 | 1.04261 | 0.0153 | ops/s | 1.49% |
| 50th percentile latency | desc-sort-with-after-timestamp-after-force-merge-1-seg | 694.29 | 556.675 | -137.615 | ms | -19.82% |
| 90th percentile latency | desc-sort-with-after-timestamp-after-force-merge-1-seg | 750.585 | 582.209 | -168.376 | ms | -22.43% |
| 99th percentile latency | desc-sort-with-after-timestamp-after-force-merge-1-seg | 833.284 | 647.059 | -186.225 | ms | -22.35% |
| 100th percentile latency | desc-sort-with-after-timestamp-after-force-merge-1-seg | 868.189 | 656.394 | -211.795 | ms | -24.40% |
| 50th percentile service time | desc-sort-with-after-timestamp-after-force-merge-1-seg | 692.68 | 555.159 | -137.521 | ms | -19.85% |
| 90th percentile service time | desc-sort-with-after-timestamp-after-force-merge-1-seg | 749.14 | 580.808 | -168.332 | ms | -22.47% |
| 99th percentile service time | desc-sort-with-after-timestamp-after-force-merge-1-seg | 831.755 | 645.946 | -185.809 | ms | -22.34% |
| 100th percentile service time | desc-sort-with-after-timestamp-after-force-merge-1-seg | 866.98 | 654.683 | -212.297 | ms | -24.49% |
| error rate | desc-sort-with-after-timestamp-after-force-merge-1-seg | 0 | 0 | 0 | % | 0.00% |
| Min Throughput | asc-sort-with-after-timestamp-after-force-merge-1-seg | 0.504405 | 0.504371 | ###### | ops/s | -0.01% |
| Mean Throughput | asc-sort-with-after-timestamp-after-force-merge-1-seg | 0.511723 | 0.511629 | ###### | ops/s | -0.02% |
| Median Throughput | asc-sort-with-after-timestamp-after-force-merge-1-seg | 0.508068 | 0.508004 | ###### | ops/s | -0.01% |
| Max Throughput | asc-sort-with-after-timestamp-after-force-merge-1-seg | 0.547848 | 0.547417 | -0.00043 | ops/s | -0.08% |
| 50th percentile latency | asc-sort-with-after-timestamp-after-force-merge-1-seg | 63.5612 | 88.5399 | 24.9787 | ms | 39.30% |
| 90th percentile latency | asc-sort-with-after-timestamp-after-force-merge-1-seg | 76.791 | 92.9108 | 16.1198 | ms | 20.99% |
| 99th percentile latency | asc-sort-with-after-timestamp-after-force-merge-1-seg | 104.963 | 118.085 | 13.1215 | ms | 12.50% |
| 100th percentile latency | asc-sort-with-after-timestamp-after-force-merge-1-seg | 105.541 | 159.161 | 53.6198 | ms | 50.80% |
| 50th percentile service time | asc-sort-with-after-timestamp-after-force-merge-1-seg | 60.8479 | 85.5415 | 24.6936 | ms | 40.58% |
| 90th percentile service time | asc-sort-with-after-timestamp-after-force-merge-1-seg | 73.6437 | 89.2742 | 15.6305 | ms | 21.22% |
| 99th percentile service time | asc-sort-with-after-timestamp-after-force-merge-1-seg | 101.033 | 114.966 | 13.9325 | ms | 13.79% |
| 100th percentile service time | asc-sort-with-after-timestamp-after-force-merge-1-seg | 102.378 | 158.334 | 55.9557 | ms | 54.66% |
| error rate | asc-sort-with-after-timestamp-after-force-merge-1-seg | 0 | 0 | 0 | % | 0.00% |
Key findings
On the http_logs write-intensive log ingestion workload, the AMD cluster outperforms the Intel cluster on indexing throughput and latency.
Indexing (`index-append` task)
Throughput: AMD is 16–20% higher than Intel (mean throughput: 259,191 vs. 219,531 docs/s)
P50 latency: AMD is 18% lower (65.7 ms vs. 80.1 ms)
Cumulative indexing time: AMD completes 21% faster (102 min vs. 130 min)
Aggregations (`hourly_agg` task)
AMD shows 35–39% lower latency across all percentiles
Numeric sort tasks (`sort_numeric_can_match_shortcut`, `sort_numeric_no_can_match_shortcut`)
AMD throughput is approximately 27% higher; latency is approximately 41% lower
Mixed results on other tasks
On some timestamp sort and keyword sort tasks — for example,
asc_sort_with_after_timestamp— AMD shows higher latency at tail percentiles. Results vary by query pattern.
These results are specific to the http_logs write-heavy workload. For your own workloads, run a benchmark with Rally using your production data before selecting an instance type.