This page provides benchmark results for an Alibaba Cloud Elasticsearch V8.9.1 cluster with 16-vCPU, 64 GiB data nodes. The test uses the Rally tool from open-source Elasticsearch with the built-in http_logs track.
Run your own stress test with production data before making capacity decisions based on these results.
Test setup
| Item | Details |
|---|---|
| Cluster configuration | Version: 8.9.1, CPU: Intel, Data node specs: 16 vCPUs and 64 GiB of memory |
| Storage | Enhanced SSD (ESSD), PL1, 200 GiB per data node |
| Data nodes | 3 |
| Rally track | Default Rally tracks |
| Dataset | Built-in http_logs track — 258,610,096 documents (Elasticsearch Rally Hub) |
| Shards | 6 primary, 0 replica |
| bulk_size | 2,000 documents per request |
| bulk_indexing_clients | 10 parallel clients |
Test results
These results are for reference only. Run stress tests with your own production data to validate performance for your specific workload.
Main metrics
|
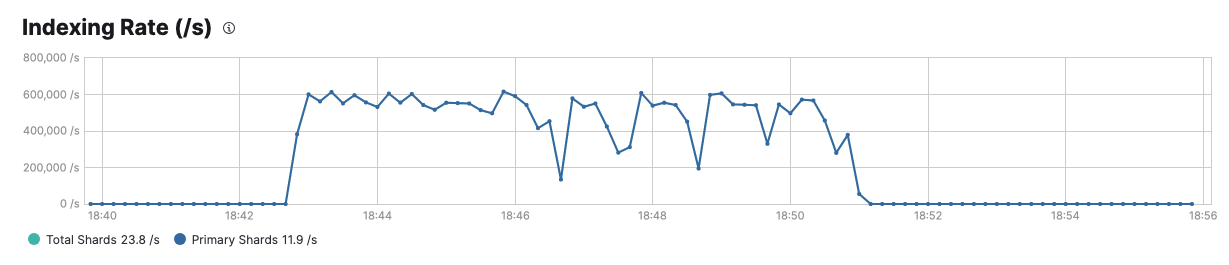
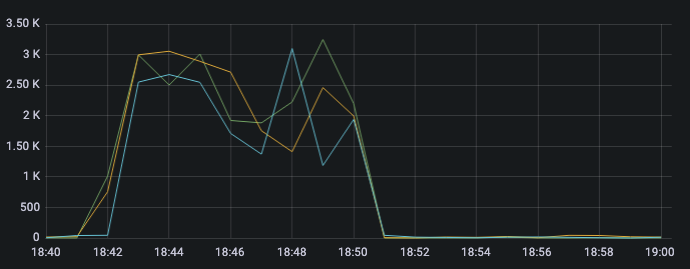
Indexing rate
|
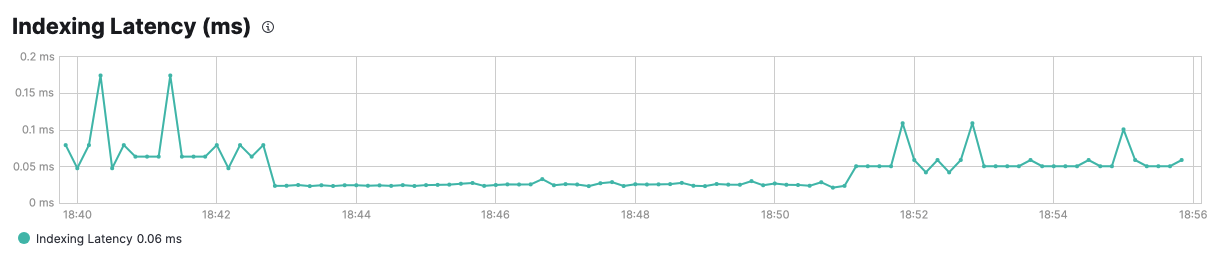
Indexing latency
|
|
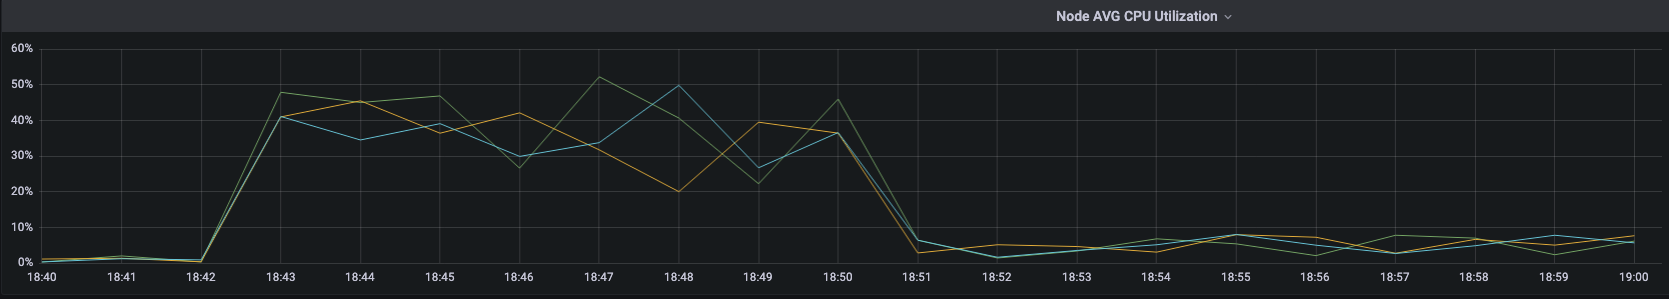
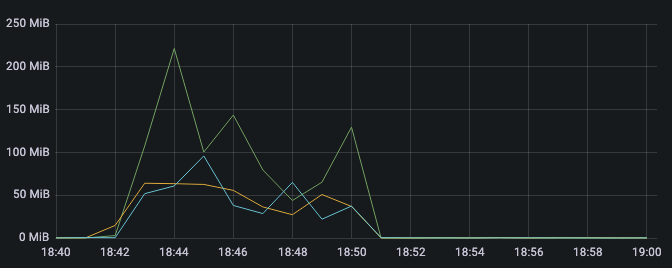
Average CPU utilization of nodes
|
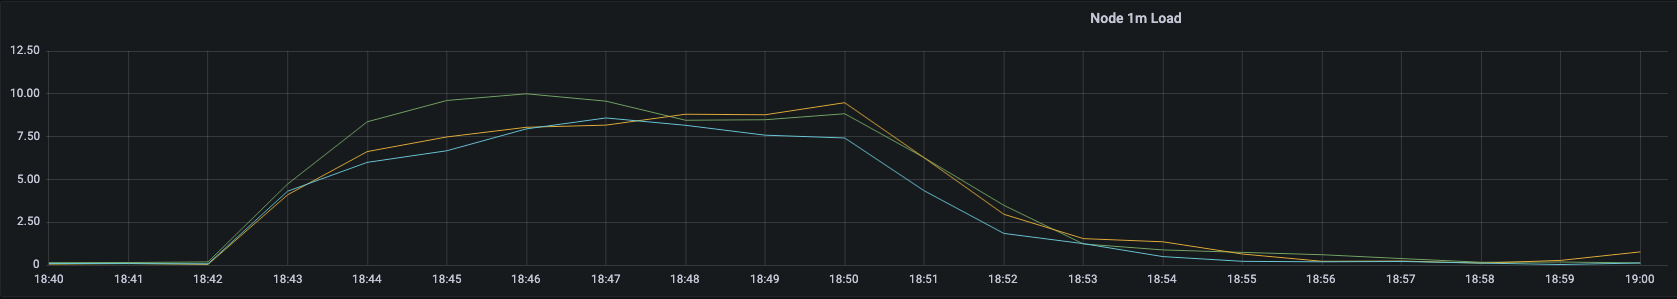
Load of each node within 1 minute
|
|
Number of write requests completed per second
|
Amount of data that is written per second
|
Test report
For metric definitions, see Overview.
How to read this table: Check the error rate first — if it is not 0%, the other metrics are not meaningful. Once you confirm errors are absent, evaluate throughput, then latency percentiles.
Latency vs. service time: Rally defines these differently from tools such as JMeter.
-
Latency: the time from when a request is submitted to when the complete response is received, including any queue waiting time before Elasticsearch starts processing.
-
Service time: the time Elasticsearch spends actively processing a request, excluding queue waiting time.
A large gap between service time and latency indicates requests are spending significant time waiting in the queue before processing. In this test, latency and service time are nearly identical for all tasks, indicating no queue pressure.
Cumulative timing metrics (rows for indexing, merge, refresh, and flush time) represent the sum of CPU time across all shards and indexing threads — not wall-clock elapsed time. For example, if 6 primary shards each accumulate 17 minutes of indexing CPU time, the cumulative total is 102 minutes.
Cluster-level indexing metrics
| Metric | Value | Unit |
|---|---|---|
| Cumulative indexing time of primary shards | 102.369 | min |
| Min cumulative indexing time across primary shards | 0 | min |
| Median cumulative indexing time across primary shards | 0.711267 | min |
| Max cumulative indexing time across primary shards | 12.8126 | min |
| Cumulative indexing throttle time of primary shards | 0 | min |
| Min cumulative indexing throttle time across primary shards | 0 | min |
| Median cumulative indexing throttle time across primary shards | 0 | min |
| Max cumulative indexing throttle time across primary shards | 0 | min |
| Cumulative merge time of primary shards | 38.8394 | min |
| Cumulative merge count of primary shards | 619 | - |
| Min cumulative merge time across primary shards | 0 | min |
| Median cumulative merge time across primary shards | 0.090917 | min |
| Max cumulative merge time across primary shards | 6.20867 | min |
| Cumulative merge throttle time of primary shards | 11.9978 | min |
| Min cumulative merge throttle time across primary shards | 0 | min |
| Median cumulative merge throttle time across primary shards | 0 | min |
| Max cumulative merge throttle time across primary shards | 2.13922 | min |
| Cumulative refresh time of primary shards | 3.99647 | min |
| Cumulative refresh count of primary shards | 5746 | - |
| Min cumulative refresh time across primary shards | 0 | min |
| Median cumulative refresh time across primary shards | 0.0376 | min |
| Max cumulative refresh time across primary shards | 0.38725 | min |
| Cumulative flush time of primary shards | 1.94607 | min |
| Cumulative flush count of primary shards | 707 | - |
| Min cumulative flush time across primary shards | 3.33E-05 | min |
| Median cumulative flush time across primary shards | 0.001108 | min |
| Max cumulative flush time across primary shards | 0.3201 | min |
| Total Young Gen GC time | 3.228 | s |
| Total Young Gen GC count | 204 | - |
| Total Old Gen GC time | 0 | s |
| Total Old Gen GC count | 0 | - |
| Store size | 18.8052 | GB |
| Translog size | 0.000405 | GB |
| Heap used for segments | 0 | MB |
| Heap used for doc values | 0 | MB |
| Heap used for terms | 0 | MB |
| Heap used for norms | 0 | MB |
| Heap used for points | 0 | MB |
| Heap used for stored fields | 0 | MB |
| Segment count | 51 | - |
| Total Ingest Pipeline count | 0 | - |
| Total Ingest Pipeline time | 0 | s |
| Total Ingest Pipeline failed | 0 | - |
Task-level throughput and latency
| Metric | Task | Value | Unit |
|---|---|---|---|
| Min Throughput | index-append | 503466 | docs/s |
| Mean Throughput | index-append | 519250 | docs/s |
| Median Throughput | index-append | 516300 | docs/s |
| Max Throughput | index-append | 538377 | docs/s |
| 50th percentile latency | index-append | 27.3378 | ms |
| 90th percentile latency | index-append | 32.5944 | ms |
| 99th percentile latency | index-append | 436.678 | ms |
| 99.9th percentile latency | index-append | 878.5 | ms |
| 99.99th percentile latency | index-append | 1043.51 | ms |
| 100th percentile latency | index-append | 1428.1 | ms |
| 50th percentile service time | index-append | 27.3378 | ms |
| 90th percentile service time | index-append | 32.5944 | ms |
| 99th percentile service time | index-append | 436.678 | ms |
| 99.9th percentile service time | index-append | 878.5 | ms |
| 99.99th percentile service time | index-append | 1043.51 | ms |
| 100th percentile service time | index-append | 1428.1 | ms |
| error rate | index-append | 0 | % |
| Min Throughput | default | 20.02 | ops/s |
| Mean Throughput | default | 20.02 | ops/s |
| Median Throughput | default | 20.02 | ops/s |
| Max Throughput | default | 20.02 | ops/s |
| 50th percentile latency | default | 5.51149 | ms |
| 90th percentile latency | default | 6.03594 | ms |
| 99th percentile latency | default | 13.0785 | ms |
| 100th percentile latency | default | 13.5715 | ms |
| 50th percentile service time | default | 4.25907 | ms |
| 90th percentile service time | default | 4.64726 | ms |
| 99th percentile service time | default | 11.6836 | ms |
| 100th percentile service time | default | 12.1387 | ms |
| error rate | default | 0 | % |
| Min Throughput | term | 49.93 | ops/s |
| Mean Throughput | term | 49.93 | ops/s |
| Median Throughput | term | 49.93 | ops/s |
| Max Throughput | term | 49.93 | ops/s |
| 50th percentile latency | term | 6.07161 | ms |
| 90th percentile latency | term | 6.44158 | ms |
| 99th percentile latency | term | 6.63601 | ms |
| 100th percentile latency | term | 8.0271 | ms |
| 50th percentile service time | term | 4.97954 | ms |
| 90th percentile service time | term | 5.33865 | ms |
| 99th percentile service time | term | 5.61965 | ms |
| 100th percentile service time | term | 6.57516 | ms |
| error rate | term | 0 | % |
| Min Throughput | terms_enum | 50 | ops/s |
| Mean Throughput | terms_enum | 50 | ops/s |
| Median Throughput | terms_enum | 50 | ops/s |
| Max Throughput | terms_enum | 50 | ops/s |
| 50th percentile latency | terms_enum | 6.07484 | ms |
| 90th percentile latency | terms_enum | 6.89182 | ms |
| 99th percentile latency | terms_enum | 9.76042 | ms |
| 100th percentile latency | terms_enum | 11.2901 | ms |
| 50th percentile service time | terms_enum | 4.92479 | ms |
| 90th percentile service time | terms_enum | 5.81058 | ms |
| 99th percentile service time | terms_enum | 8.03531 | ms |
| 100th percentile service time | terms_enum | 9.9108 | ms |
| error rate | terms_enum | 0 | % |
| Min Throughput | range | 25.01 | ops/s |
| Mean Throughput | range | 25.02 | ops/s |
| Median Throughput | range | 25.02 | ops/s |
| Max Throughput | range | 25.02 | ops/s |
| 50th percentile latency | range | 7.97494 | ms |
| 90th percentile latency | range | 8.62053 | ms |
| 99th percentile latency | range | 8.97499 | ms |
| 100th percentile latency | range | 8.99078 | ms |
| 50th percentile service time | range | 6.85268 | ms |
| 90th percentile service time | range | 7.4089 | ms |
| 99th percentile service time | range | 7.75342 | ms |
| 100th percentile service time | range | 7.78395 | ms |
| error rate | range | 0 | % |
| Min Throughput | 200s-in-range | 25.01 | ops/s |
| Mean Throughput | 200s-in-range | 25.01 | ops/s |
| Median Throughput | 200s-in-range | 25.01 | ops/s |
| Max Throughput | 200s-in-range | 25.01 | ops/s |
| 50th percentile latency | 200s-in-range | 6.936 | ms |
| 90th percentile latency | 200s-in-range | 7.40248 | ms |
| 99th percentile latency | 200s-in-range | 8.40093 | ms |
| 100th percentile latency | 200s-in-range | 11.5367 | ms |
| 50th percentile service time | 200s-in-range | 5.75406 | ms |
| 90th percentile service time | 200s-in-range | 6.22505 | ms |
| 99th percentile service time | 200s-in-range | 7.15061 | ms |
| 100th percentile service time | 200s-in-range | 9.99547 | ms |
| error rate | 200s-in-range | 0 | % |
| Min Throughput | 400s-in-range | 50 | ops/s |
| Mean Throughput | 400s-in-range | 50 | ops/s |
| Median Throughput | 400s-in-range | 50 | ops/s |
| Max Throughput | 400s-in-range | 50 | ops/s |
| 50th percentile latency | 400s-in-range | 5.12141 | ms |
| 90th percentile latency | 400s-in-range | 5.52136 | ms |
| 99th percentile latency | 400s-in-range | 5.75318 | ms |
| 100th percentile latency | 400s-in-range | 5.87092 | ms |
| 50th percentile service time | 400s-in-range | 4.03716 | ms |
| 90th percentile service time | 400s-in-range | 4.34921 | ms |
| 99th percentile service time | 400s-in-range | 4.89859 | ms |
| 100th percentile service time | 400s-in-range | 5.05741 | ms |
| error rate | 400s-in-range | 0 | % |
| Min Throughput | hourly_agg | 0.2 | ops/s |
| Mean Throughput | hourly_agg | 0.2 | ops/s |
| Median Throughput | hourly_agg | 0.2 | ops/s |
| Max Throughput | hourly_agg | 0.2 | ops/s |
| 50th percentile latency | hourly_agg | 1755.86 | ms |
| 90th percentile latency | hourly_agg | 1996.02 | ms |
| 99th percentile latency | hourly_agg | 2020.95 | ms |
| 100th percentile latency | hourly_agg | 2040.73 | ms |
| 50th percentile service time | hourly_agg | 1754.43 | ms |
| 90th percentile service time | hourly_agg | 1994.31 | ms |
| 99th percentile service time | hourly_agg | 2019.07 | ms |
| 100th percentile service time | hourly_agg | 2037.99 | ms |
| error rate | hourly_agg | 0 | % |
| Min Throughput | scroll | 25.05 | pages/s |
| Mean Throughput | scroll | 25.08 | pages/s |
| Median Throughput | scroll | 25.07 | pages/s |
| Max Throughput | scroll | 25.14 | pages/s |
| 50th percentile latency | scroll | 234.742 | ms |
| 90th percentile latency | scroll | 242.755 | ms |
| 99th percentile latency | scroll | 250.337 | ms |
| 100th percentile latency | scroll | 337.316 | ms |
| 50th percentile service time | scroll | 232.442 | ms |
| 90th percentile service time | scroll | 240.834 | ms |
| 99th percentile service time | scroll | 247.915 | ms |
| 100th percentile service time | scroll | 335.292 | ms |
| error rate | scroll | 0 | % |
| Min Throughput | desc_sort_timestamp | 2 | ops/s |
| Mean Throughput | desc_sort_timestamp | 2 | ops/s |
| Median Throughput | desc_sort_timestamp | 2 | ops/s |
| Max Throughput | desc_sort_timestamp | 2.01 | ops/s |
| 50th percentile latency | desc_sort_timestamp | 31.5901 | ms |
| 90th percentile latency | desc_sort_timestamp | 33.8105 | ms |
| 99th percentile latency | desc_sort_timestamp | 38.3762 | ms |
| 100th percentile latency | desc_sort_timestamp | 44.696 | ms |
| 50th percentile service time | desc_sort_timestamp | 29.8104 | ms |
| 90th percentile service time | desc_sort_timestamp | 32.4009 | ms |
| 99th percentile service time | desc_sort_timestamp | 37.0111 | ms |
| 100th percentile service time | desc_sort_timestamp | 43.2011 | ms |
| error rate | desc_sort_timestamp | 0 | % |
| Min Throughput | asc_sort_timestamp | 20.05 | ops/s |
| Mean Throughput | asc_sort_timestamp | 20.06 | ops/s |
| Median Throughput | asc_sort_timestamp | 20.06 | ops/s |
| Max Throughput | asc_sort_timestamp | 20.07 | ops/s |
| 50th percentile latency | asc_sort_timestamp | 8.3407 | ms |
| 90th percentile latency | asc_sort_timestamp | 9.04953 | ms |
| 99th percentile latency | asc_sort_timestamp | 15.3909 | ms |
| 100th percentile latency | asc_sort_timestamp | 20.5605 | ms |
| 50th percentile service time | asc_sort_timestamp | 7.2043 | ms |
| 90th percentile service time | asc_sort_timestamp | 7.83903 | ms |
| 99th percentile service time | asc_sort_timestamp | 14.0796 | ms |
| 100th percentile service time | asc_sort_timestamp | 19.0772 | ms |
| error rate | asc_sort_timestamp | 0 | % |
| Min Throughput | desc_sort_with_after_timestamp | 1.01 | ops/s |
| Mean Throughput | desc_sort_with_after_timestamp | 1.02 | ops/s |
| Median Throughput | desc_sort_with_after_timestamp | 1.01 | ops/s |
| Max Throughput | desc_sort_with_after_timestamp | 1.09 | ops/s |
| 50th percentile latency | desc_sort_with_after_timestamp | 41.1498 | ms |
| 90th percentile latency | desc_sort_with_after_timestamp | 47.7046 | ms |
| 99th percentile latency | desc_sort_with_after_timestamp | 71.4477 | ms |
| 100th percentile latency | desc_sort_with_after_timestamp | 124.917 | ms |
| 50th percentile service time | desc_sort_with_after_timestamp | 38.462 | ms |
| 90th percentile service time | desc_sort_with_after_timestamp | 45.2714 | ms |
| 99th percentile service time | desc_sort_with_after_timestamp | 68.8765 | ms |
| 100th percentile service time | desc_sort_with_after_timestamp | 121.753 | ms |
| error rate | desc_sort_with_after_timestamp | 0 | % |
| Min Throughput | asc_sort_with_after_timestamp | 0.5 | ops/s |
| Mean Throughput | asc_sort_with_after_timestamp | 0.51 | ops/s |
| Median Throughput | asc_sort_with_after_timestamp | 0.51 | ops/s |
| Max Throughput | asc_sort_with_after_timestamp | 0.55 | ops/s |
| 50th percentile latency | asc_sort_with_after_timestamp | 13.9578 | ms |
| 90th percentile latency | asc_sort_with_after_timestamp | 14.9613 | ms |
| 99th percentile latency | asc_sort_with_after_timestamp | 28.89 | ms |
| 100th percentile latency | asc_sort_with_after_timestamp | 31.1749 | ms |
| 50th percentile service time | asc_sort_with_after_timestamp | 11.1284 | ms |
| 90th percentile service time | asc_sort_with_after_timestamp | 11.9826 | ms |
| 99th percentile service time | asc_sort_with_after_timestamp | 20.231 | ms |
| 100th percentile service time | asc_sort_with_after_timestamp | 29.4107 | ms |
| error rate | asc_sort_with_after_timestamp | 0 | % |
| Min Throughput | desc_sort_timestamp_can_match_shortcut | 2.01 | ops/s |
| Mean Throughput | desc_sort_timestamp_can_match_shortcut | 2.01 | ops/s |
| Median Throughput | desc_sort_timestamp_can_match_shortcut | 2.01 | ops/s |
| Max Throughput | desc_sort_timestamp_can_match_shortcut | 2.01 | ops/s |
| 50th percentile latency | desc_sort_timestamp_can_match_shortcut | 36.3372 | ms |
| 90th percentile latency | desc_sort_timestamp_can_match_shortcut | 41.905 | ms |
| 99th percentile latency | desc_sort_timestamp_can_match_shortcut | 48.6297 | ms |
| 100th percentile latency | desc_sort_timestamp_can_match_shortcut | 49.1483 | ms |
| 50th percentile service time | desc_sort_timestamp_can_match_shortcut | 34.8325 | ms |
| 90th percentile service time | desc_sort_timestamp_can_match_shortcut | 40.1548 | ms |
| 99th percentile service time | desc_sort_timestamp_can_match_shortcut | 47.2503 | ms |
| 100th percentile service time | desc_sort_timestamp_can_match_shortcut | 47.502 | ms |
| error rate | desc_sort_timestamp_can_match_shortcut | 0 | % |
| Min Throughput | desc_sort_timestamp_no_can_match_shortcut | 2.01 | ops/s |
| Mean Throughput | desc_sort_timestamp_no_can_match_shortcut | 2.01 | ops/s |
| Median Throughput | desc_sort_timestamp_no_can_match_shortcut | 2.01 | ops/s |
| Max Throughput | desc_sort_timestamp_no_can_match_shortcut | 2.01 | ops/s |
| 50th percentile latency | desc_sort_timestamp_no_can_match_shortcut | 37.7254 | ms |
| 90th percentile latency | desc_sort_timestamp_no_can_match_shortcut | 45.3597 | ms |
| 99th percentile latency | desc_sort_timestamp_no_can_match_shortcut | 47.7873 | ms |
| 100th percentile latency | desc_sort_timestamp_no_can_match_shortcut | 49.1575 | ms |
| 50th percentile service time | desc_sort_timestamp_no_can_match_shortcut | 36.3303 | ms |
| 90th percentile service time | desc_sort_timestamp_no_can_match_shortcut | 43.9334 | ms |
| 99th percentile service time | desc_sort_timestamp_no_can_match_shortcut | 46.5774 | ms |
| 100th percentile service time | desc_sort_timestamp_no_can_match_shortcut | 47.1958 | ms |
| error rate | desc_sort_timestamp_no_can_match_shortcut | 0 | % |
| Min Throughput | sort_keyword_can_match_shortcut | 2.01 | ops/s |
| Mean Throughput | sort_keyword_can_match_shortcut | 2.01 | ops/s |
| Median Throughput | sort_keyword_can_match_shortcut | 2.01 | ops/s |
| Max Throughput | sort_keyword_can_match_shortcut | 2.01 | ops/s |
| 50th percentile latency | sort_keyword_can_match_shortcut | 9.36402 | ms |
| 90th percentile latency | sort_keyword_can_match_shortcut | 9.96062 | ms |
| 99th percentile latency | sort_keyword_can_match_shortcut | 11.2473 | ms |
| 100th percentile latency | sort_keyword_can_match_shortcut | 12.2157 | ms |
| 50th percentile service time | sort_keyword_can_match_shortcut | 7.87465 | ms |
| 90th percentile service time | sort_keyword_can_match_shortcut | 8.33036 | ms |
| 99th percentile service time | sort_keyword_can_match_shortcut | 9.16105 | ms |
| 100th percentile service time | sort_keyword_can_match_shortcut | 10.4864 | ms |
| error rate | sort_keyword_can_match_shortcut | 0 | % |
| Min Throughput | sort_keyword_no_can_match_shortcut | 2.01 | ops/s |
| Mean Throughput | sort_keyword_no_can_match_shortcut | 2.01 | ops/s |
| Median Throughput | sort_keyword_no_can_match_shortcut | 2.01 | ops/s |
| Max Throughput | sort_keyword_no_can_match_shortcut | 2.01 | ops/s |
| 50th percentile latency | sort_keyword_no_can_match_shortcut | 8.19808 | ms |
| 90th percentile latency | sort_keyword_no_can_match_shortcut | 8.77071 | ms |
| 99th percentile latency | sort_keyword_no_can_match_shortcut | 9.44634 | ms |
| 100th percentile latency | sort_keyword_no_can_match_shortcut | 9.70565 | ms |
| 50th percentile service time | sort_keyword_no_can_match_shortcut | 6.52511 | ms |
| 90th percentile service time | sort_keyword_no_can_match_shortcut | 7.03643 | ms |
| 99th percentile service time | sort_keyword_no_can_match_shortcut | 7.91567 | ms |
| 100th percentile service time | sort_keyword_no_can_match_shortcut | 8.16122 | ms |
| error rate | sort_keyword_no_can_match_shortcut | 0 | % |
| Min Throughput | sort_numeric_can_match_shortcut | 1.1 | ops/s |
| Mean Throughput | sort_numeric_can_match_shortcut | 1.11 | ops/s |
| Median Throughput | sort_numeric_can_match_shortcut | 1.11 | ops/s |
| Max Throughput | sort_numeric_can_match_shortcut | 1.12 | ops/s |
| 50th percentile latency | sort_numeric_can_match_shortcut | 101209 | ms |
| 90th percentile latency | sort_numeric_can_match_shortcut | 118692 | ms |
| 99th percentile latency | sort_numeric_can_match_shortcut | 122533 | ms |
| 100th percentile latency | sort_numeric_can_match_shortcut | 123103 | ms |
| 50th percentile service time | sort_numeric_can_match_shortcut | 1000.97 | ms |
| 90th percentile service time | sort_numeric_can_match_shortcut | 1080.05 | ms |
| 99th percentile service time | sort_numeric_can_match_shortcut | 1095.82 | ms |
| 100th percentile service time | sort_numeric_can_match_shortcut | 1096.24 | ms |
| error rate | sort_numeric_can_match_shortcut | 0 | % |
| Min Throughput | sort_numeric_no_can_match_shortcut | 1.12 | ops/s |
| Mean Throughput | sort_numeric_no_can_match_shortcut | 1.12 | ops/s |
| Median Throughput | sort_numeric_no_can_match_shortcut | 1.12 | ops/s |
| Max Throughput | sort_numeric_no_can_match_shortcut | 1.13 | ops/s |
| 50th percentile latency | sort_numeric_no_can_match_shortcut | 98668.4 | ms |
| 90th percentile latency | sort_numeric_no_can_match_shortcut | 113322 | ms |
| 99th percentile latency | sort_numeric_no_can_match_shortcut | 116559 | ms |
| 100th percentile latency | sort_numeric_no_can_match_shortcut | 116846 | ms |
| 50th percentile service time | sort_numeric_no_can_match_shortcut | 795.33 | ms |
| 90th percentile service time | sort_numeric_no_can_match_shortcut | 1104.73 | ms |
| 99th percentile service time | sort_numeric_no_can_match_shortcut | 1141.59 | ms |
| 100th percentile service time | sort_numeric_no_can_match_shortcut | 1148.95 | ms |
| error rate | sort_numeric_no_can_match_shortcut | 0 | % |
| Min Throughput | desc-sort-timestamp-after-force-merge-1-seg | 1 | ops/s |
| Mean Throughput | desc-sort-timestamp-after-force-merge-1-seg | 1 | ops/s |
| Median Throughput | desc-sort-timestamp-after-force-merge-1-seg | 1 | ops/s |
| Max Throughput | desc-sort-timestamp-after-force-merge-1-seg | 1 | ops/s |
| 50th percentile latency | desc-sort-timestamp-after-force-merge-1-seg | 60.6284 | ms |
| 90th percentile latency | desc-sort-timestamp-after-force-merge-1-seg | 79.2922 | ms |
| 99th percentile latency | desc-sort-timestamp-after-force-merge-1-seg | 88.8805 | ms |
| 100th percentile latency | desc-sort-timestamp-after-force-merge-1-seg | 286.93 | ms |
| 50th percentile service time | desc-sort-timestamp-after-force-merge-1-seg | 58.2357 | ms |
| 90th percentile service time | desc-sort-timestamp-after-force-merge-1-seg | 76.5327 | ms |
| 99th percentile service time | desc-sort-timestamp-after-force-merge-1-seg | 86.5926 | ms |
| 100th percentile service time | desc-sort-timestamp-after-force-merge-1-seg | 284.471 | ms |
| error rate | desc-sort-timestamp-after-force-merge-1-seg | 0 | % |
| Min Throughput | asc-sort-timestamp-after-force-merge-1-seg | 49.13 | ops/s |
| Mean Throughput | asc-sort-timestamp-after-force-merge-1-seg | 49.2 | ops/s |
| Median Throughput | asc-sort-timestamp-after-force-merge-1-seg | 49.2 | ops/s |
| Max Throughput | asc-sort-timestamp-after-force-merge-1-seg | 49.27 | ops/s |
| 50th percentile latency | asc-sort-timestamp-after-force-merge-1-seg | 7.26975 | ms |
| 90th percentile latency | asc-sort-timestamp-after-force-merge-1-seg | 8.16118 | ms |
| 99th percentile latency | asc-sort-timestamp-after-force-merge-1-seg | 8.66191 | ms |
| 100th percentile latency | asc-sort-timestamp-after-force-merge-1-seg | 9.04285 | ms |
| 50th percentile service time | asc-sort-timestamp-after-force-merge-1-seg | 5.68646 | ms |
| 90th percentile service time | asc-sort-timestamp-after-force-merge-1-seg | 7.15841 | ms |
| 99th percentile service time | asc-sort-timestamp-after-force-merge-1-seg | 7.51591 | ms |
| 100th percentile service time | asc-sort-timestamp-after-force-merge-1-seg | 7.92766 | ms |
| error rate | asc-sort-timestamp-after-force-merge-1-seg | 0 | % |
| Min Throughput | desc-sort-with-after-timestamp-after-force-merge-1-seg | 1.01 | ops/s |
| Mean Throughput | desc-sort-with-after-timestamp-after-force-merge-1-seg | 1.01 | ops/s |
| Median Throughput | desc-sort-with-after-timestamp-after-force-merge-1-seg | 1.01 | ops/s |
| Max Throughput | desc-sort-with-after-timestamp-after-force-merge-1-seg | 1.06 | ops/s |
| 50th percentile latency | desc-sort-with-after-timestamp-after-force-merge-1-seg | 393.162 | ms |
| 90th percentile latency | desc-sort-with-after-timestamp-after-force-merge-1-seg | 514.315 | ms |
| 99th percentile latency | desc-sort-with-after-timestamp-after-force-merge-1-seg | 520.91 | ms |
| 100th percentile latency | desc-sort-with-after-timestamp-after-force-merge-1-seg | 523.011 | ms |
| 50th percentile service time | desc-sort-with-after-timestamp-after-force-merge-1-seg | 391.428 | ms |
| 90th percentile service time | desc-sort-with-after-timestamp-after-force-merge-1-seg | 512.855 | ms |
| 99th percentile service time | desc-sort-with-after-timestamp-after-force-merge-1-seg | 519.339 | ms |
| 100th percentile service time | desc-sort-with-after-timestamp-after-force-merge-1-seg | 520.944 | ms |
| error rate | desc-sort-with-after-timestamp-after-force-merge-1-seg | 0 | % |
| Min Throughput | asc-sort-with-after-timestamp-after-force-merge-1-seg | 0.5 | ops/s |
| Mean Throughput | asc-sort-with-after-timestamp-after-force-merge-1-seg | 0.51 | ops/s |
| Median Throughput | asc-sort-with-after-timestamp-after-force-merge-1-seg | 0.51 | ops/s |
| Max Throughput | asc-sort-with-after-timestamp-after-force-merge-1-seg | 0.55 | ops/s |
| 50th percentile latency | asc-sort-with-after-timestamp-after-force-merge-1-seg | 79.3985 | ms |
| 90th percentile latency | asc-sort-with-after-timestamp-after-force-merge-1-seg | 93.5664 | ms |
| 99th percentile latency | asc-sort-with-after-timestamp-after-force-merge-1-seg | 100.714 | ms |
| 100th percentile latency | asc-sort-with-after-timestamp-after-force-merge-1-seg | 104.124 | ms |
| 50th percentile service time | asc-sort-with-after-timestamp-after-force-merge-1-seg | 76.4448 | ms |
| 90th percentile service time | asc-sort-with-after-timestamp-after-force-merge-1-seg | 90.3036 | ms |
| 99th percentile service time | asc-sort-with-after-timestamp-after-force-merge-1-seg | 97.415 | ms |
| 100th percentile service time | asc-sort-with-after-timestamp-after-force-merge-1-seg | 99.6565 | ms |
| error rate | asc-sort-with-after-timestamp-after-force-merge-1-seg | 0 | % |