On the Application Overview page of an application in the Enterprise Distributed Application Service (EDAS) console, you can view the following information about the application: its Kubernetes cluster, region, microservices namespace, and running status. You can also view health metrics of the application, such as the total number of requests and average response time, services provided by the application, services on which the application depends, and system information such as CPU utilization and memory usage.
Procedure
Log on to the EDAS console.
In the left-side navigation pane, choose Application Management > Applications. In the top navigation bar, select a region, select a microservices namespace from the Microservices Namespace drop-down list, select Kubernetes Cluster from the Cluster Type drop-down list, and then click the name of the desired application.
View the overall information about an application
On the Application Overview page, you can view the application information, including its Kubernetes cluster, diagnostic report, region, cluster type, status, creation time, specifications, and Server Load Balancer (SLB) setting.
For more information about the overall analysis of the application, see View the overall analysis of the application on the Overview tab.
For more information about the topology of the application, see View the topology of the application on the Topology tab.
For more information about how to change instance specifications in EDAS, see Manual scaling.
For more information about how to configure load balancing, see Bind CLB instances.
For more information about how to configure a Service, see Add a Service.
For more information about how to configure a YAML file, see Configure a YAML file.
For more information about application deployment and rollback, see Manage the application lifecycle.
View the overall analysis of the application on the Overview tab
On the Overview tab, you can view the following performance metrics:
Total Requests, Average Response Time, Error count, Full GC, Slow SQL, Exceptions, and Thread Profiling.
You can also view the week-on-week differences and day-on-day differences of the preceding metric values. 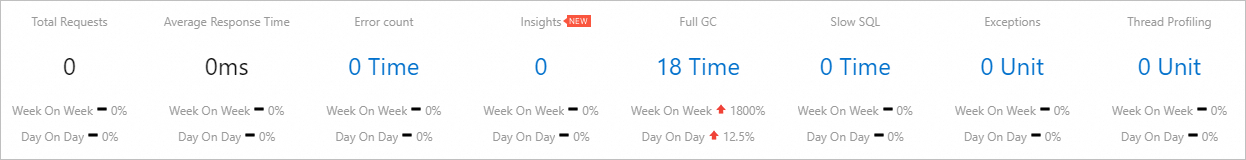
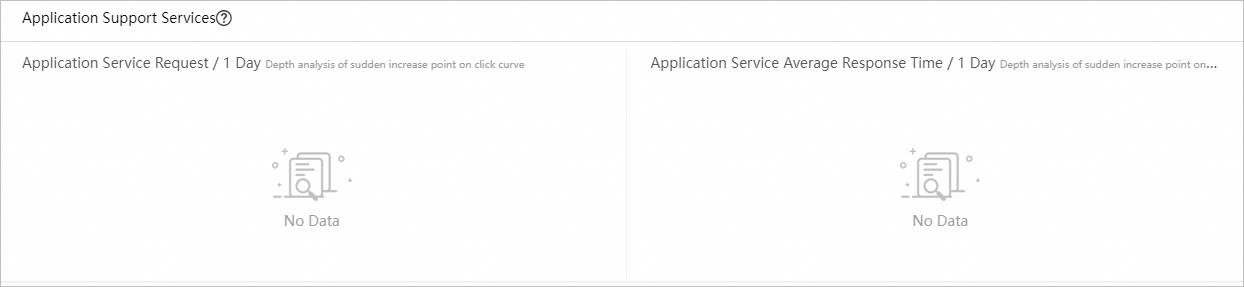
Application Support Services: the time series curves for the number of requests to and the average response time of the services that are provided by the application. If you use EDAS Professional Edition or Platinum Edition, you can click a spike in the curves to perform in-depth analysis.
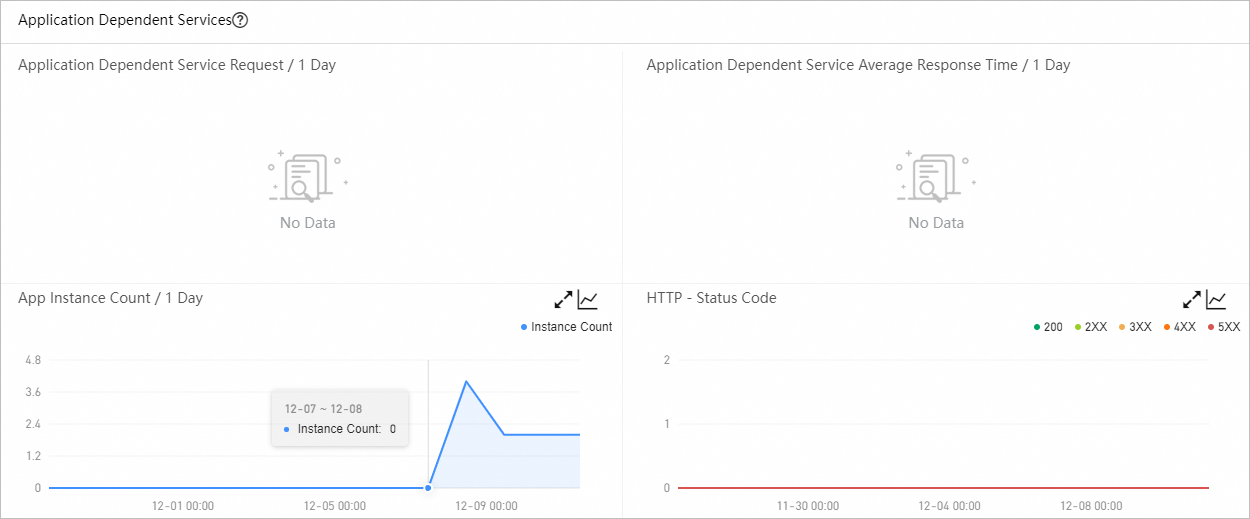
Application Dependent Services: the time series curves for the number of requests to and the average response time of the services on which the application depends. You can also view the time series curves for the number of instances associated with the application and HTTP status codes.
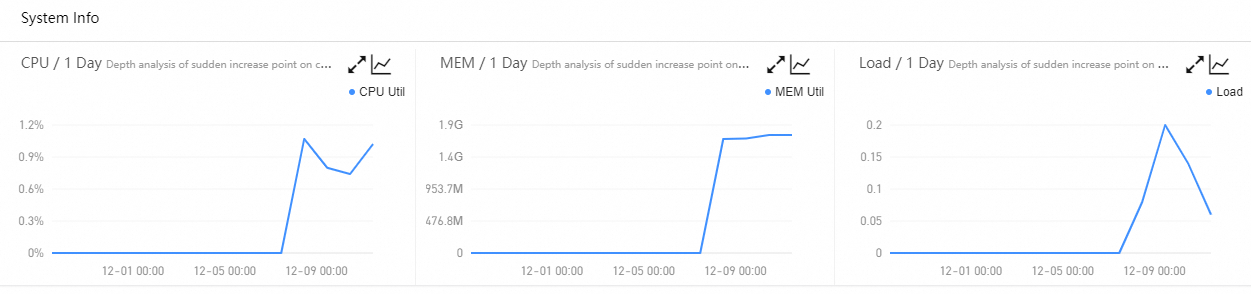
System Info: the time series curves for CPU utilization, memory usage, and load.
Thread Profiling: the time series curves and the details of slow calls.
Statistical Analysis: the analysis on slow API calls and exception types.
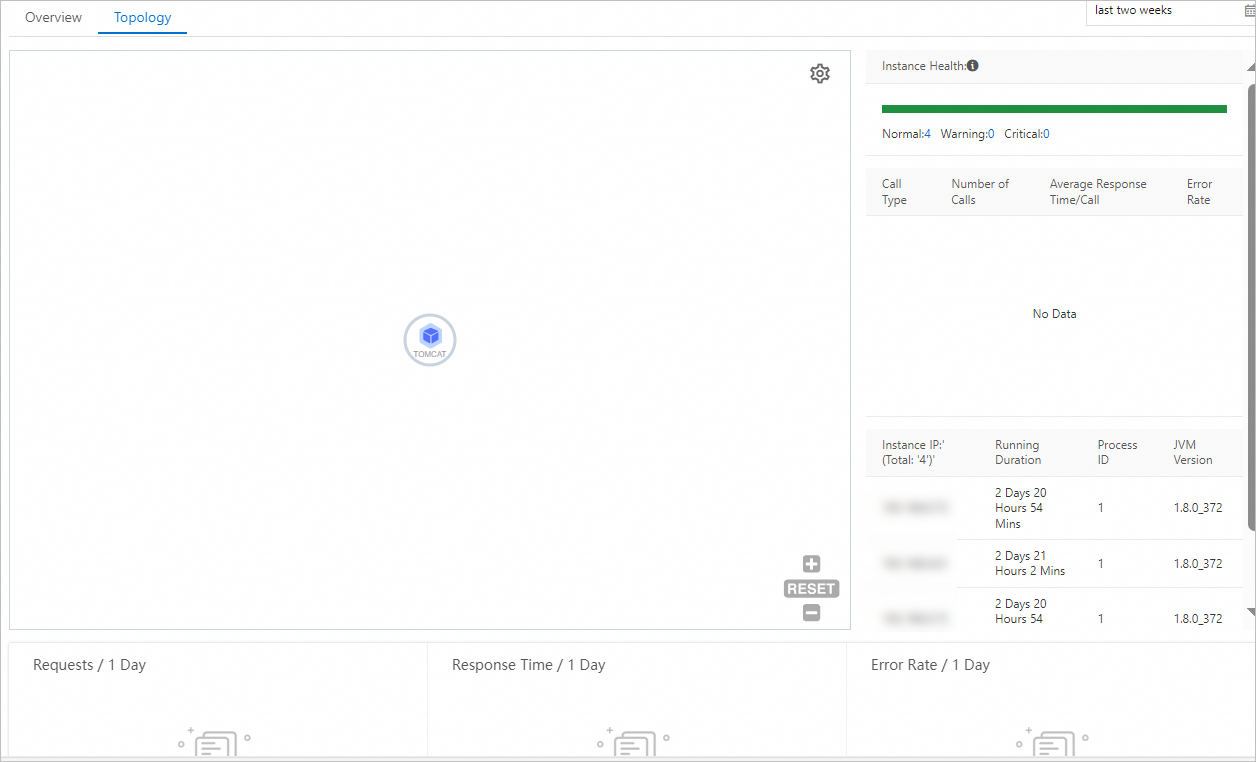
View the topology of the application on the Topology tab
EDAS provides the topology of an application for Professional Edition and Platinum Edition, but not for Standard Edition.
On the Topology tab, you can view the upstream and downstream components of your application and the call relationship between a component and the application. The topology helps you quickly identify the bottlenecks of your application.