When you deploy distributed applications on EDAS, you need a centralized place to check application health, spot performance issues, and trace service dependencies. The Application Overview page in the Enterprise Distributed Application Service (EDAS) console consolidates application status, performance metrics, resource utilization, and service topology into a single view.
From the Application Overview page, you can:
| Goal | Section |
|---|---|
| Check application status, cluster, region, and specifications | Application information |
| Monitor request volume, response time, errors, and GC activity | Performance metrics |
| Analyze service request trends and response times | Application Support Services / Application Dependent Services |
| Track CPU, memory, and load utilization | System Info |
| Identify slow calls and exceptions | Thread Profiling / Statistical Analysis |
| Visualize upstream and downstream dependencies | Topology tab |
Open the Application Overview page
-
Log on to the EDAS console.
In the left-side navigation pane, choose Application Management > Applications.
In the top navigation bar, select a region, select a microservices namespace from the Microservices Namespace drop-down list, and then select Kubernetes Cluster from the Cluster Type drop-down list.
Click the name of the target application. The Application Overview page appears.
Application information
The top of the Application Overview page displays the following details:
| Property | Description |
|---|---|
| Kubernetes cluster | Cluster where the application is deployed |
| Region | Deployment region |
| Cluster type | Kubernetes Cluster |
| Status | Current running status |
| Creation time | When the application was created |
| Specifications | Instance specifications |
| Diagnostic report | Health diagnostic report for the application |
| Server Load Balancer (SLB) | Load balancer settings |
Related operations
The following operations are available from this page:
| Operation | Description |
|---|---|
| Manual scaling | Change instance specifications |
| Bind CLB instances | Configure load balancing |
| Add a Service | Create a Kubernetes Service |
| Configure a YAML file | Edit the application YAML |
| Manage the application lifecycle | Deploy or roll back the application |
Overview tab
The Overview tab provides performance metrics and service health data.
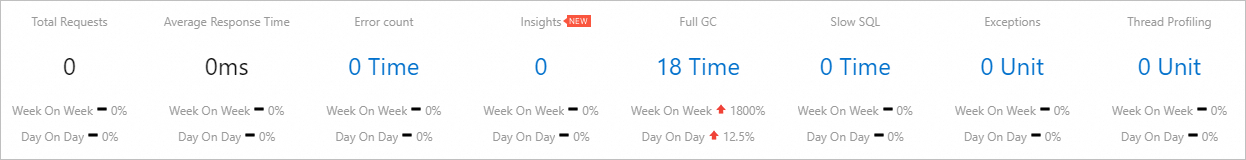
Performance metrics
The following metrics are displayed at the top of the Overview tab. Each metric includes week-on-week and day-on-day comparisons.
| Metric | Description |
|---|---|
| Total Requests | Total number of incoming requests during the selected period |
| Average Response Time | Mean response time across all requests |
| Error count | Number of requests that returned errors |
| Full GC | Number of full garbage collection events |
| Slow SQL | Number of slow SQL queries detected |
| Exceptions | Number of application exceptions |
| Thread Profiling | Thread-level performance profiling data |
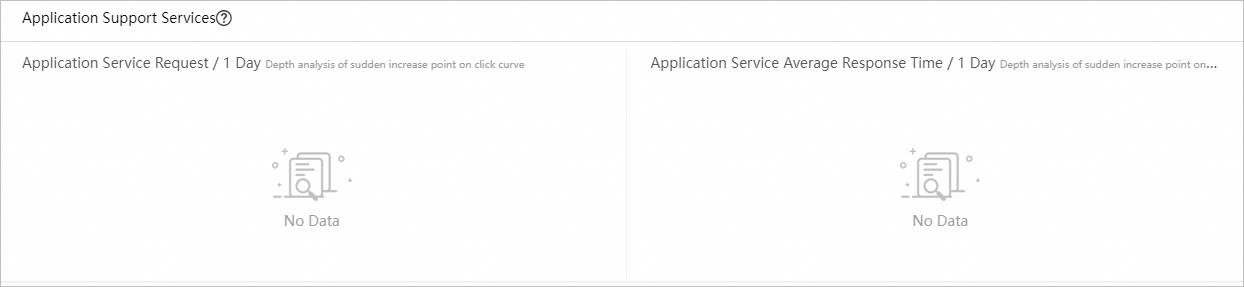
Application Support Services
Time series curves display the request count and average response time of services that your application provides.
With EDAS Professional Edition or Platinum Edition, click a spike in the curve to start in-depth analysis.
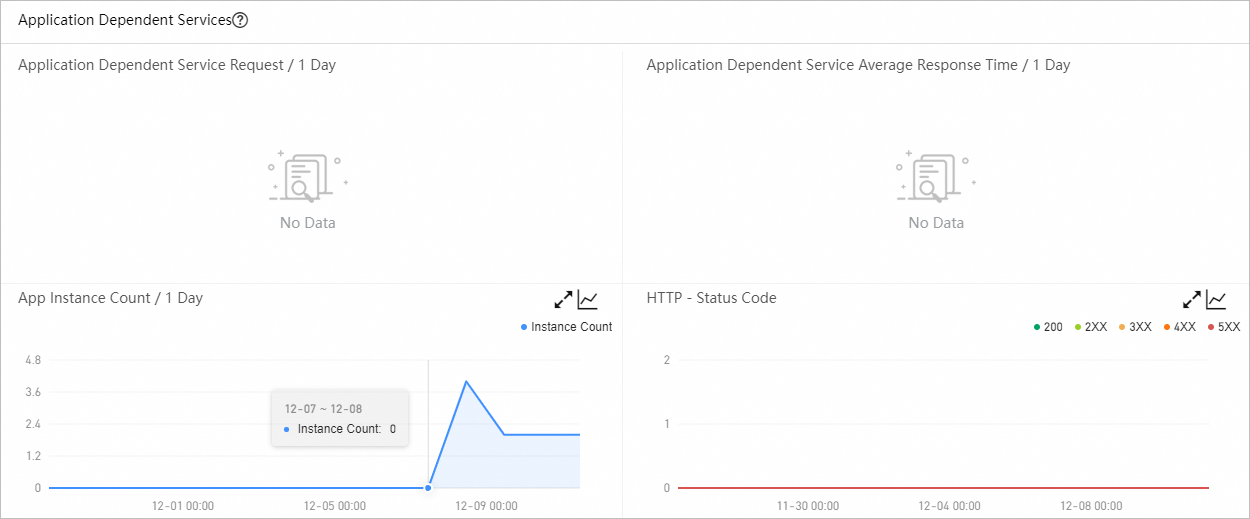
Application Dependent Services
Time series curves display the request count and average response time of services that your application depends on. Additional curves show the number of associated instances and HTTP status codes.
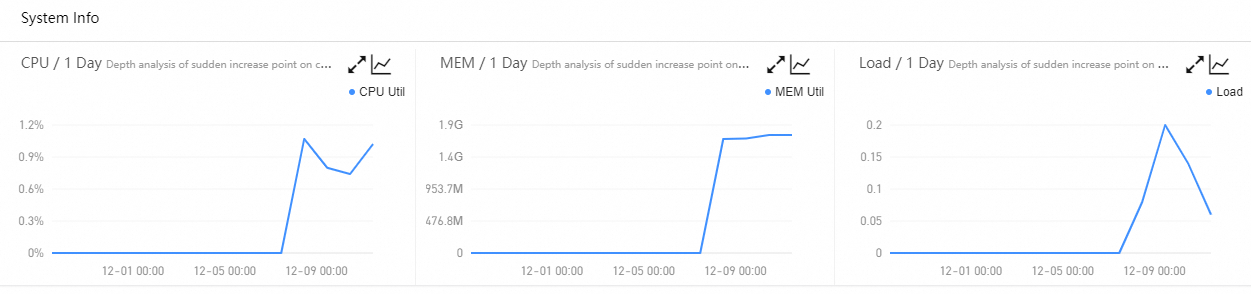
System Info
Time series curves track CPU utilization, memory usage, and load.
Thread Profiling
Time series curves and details of slow calls help you pinpoint latency issues.
Statistical Analysis
Breakdowns of slow API calls and exception types.
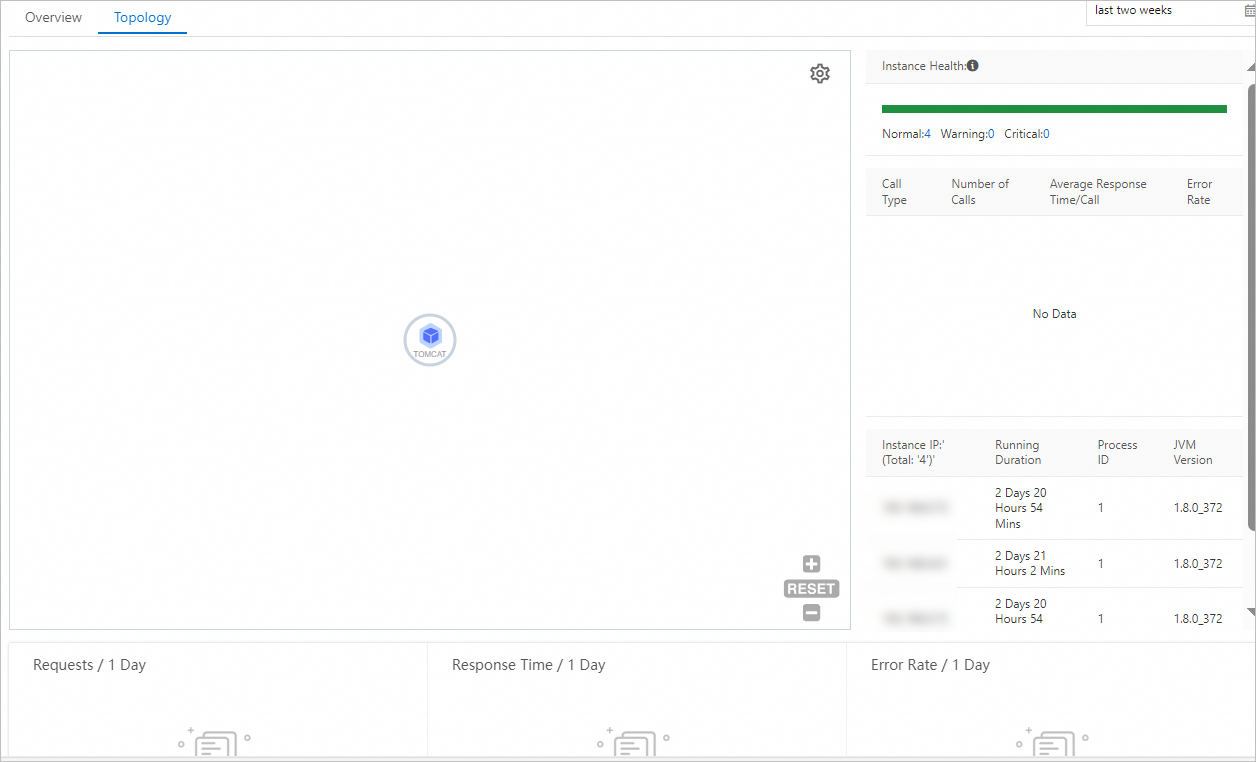
Topology tab
The topology feature is available only for EDAS Professional Edition and Platinum Edition. It is not available for Standard Edition.
The Topology tab shows the upstream and downstream components of your application and the call relationships between them. Use this view to identify performance bottlenecks.