The event center centralizes, stores, analyzes, and displays event data generated by Alibaba Cloud services and collects the following types of events: change events of Enterprise Distributed Application Service (EDAS), alert events of Application Real-Time Monitoring Service (ARMS), zero-one events such as deadlocks, out-of-memory (OOM), and application startups, microservices governance events of Microservices Engine (MSE), and Kubernetes cluster events. If your application uses one of the preceding services, the event center automatically collects the events and analyzes and displays the events in a unified manner. This provides an easy way for you to view and analyze the events.
Event model
The following table describes the parameters of an event in the event center.
Parameter | Required | Description |
source | Yes | The source of the event. |
type | Yes | The event type. |
level | Yes | The severity level of the event. |
time | Yes | The time when the event occurred. |
data | Yes | The event body. In most cases, the event body is in the JSON format. |
PID | No | The pod ID. |
IP | No | The IP address. |
ClusterId | No | The cluster ID. |
PodName | No | The pod name. |
Go to the event center
Log on to the EDAS console. In the left-side navigation pane, choose . In the top navigation bar, select a region. In the upper part of the Applications page, select a microservices namespace from the Microservices Namespace drop-down list. Select Kubernetes Cluster from the Cluster Type drop-down list. Then, click the name of the application that you want to manage.
In the left-side navigation pane, click Event Center.
Modules of the event center
In the EDAS console, the Event Overview page of the event center contains the typical events section and the Standard View, Topology View, and Subscription Rules tabs.
Typical events: The number of typical events preset by the system is displayed. For more information, see Typical events section.
Standard View: All events associated with the application are analyzed and displayed in multiple dimensions. For more information, see Standard View tab.
Topology View: The events associated with the application and the resource topology of the application are displayed together. For more information, see Topology View tab.
Subscription rules: The created subscription rules are displayed in a list. For more information, see Subscription Rules tab.
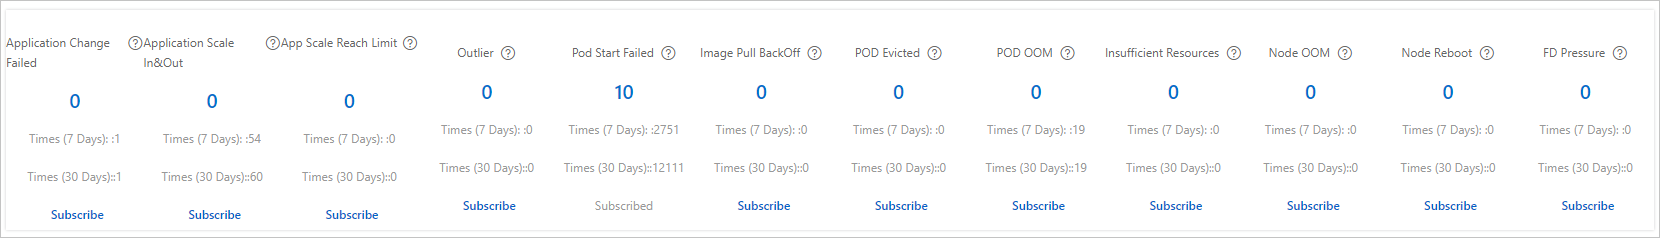
Typical events section
The typical events section displays the number of occurrences for each type of the preset typical event within the last 30 minutes. In the upper-right corner of the tab, you can adjust the time range by using the date and time picker. If you want to modify the subscription rule of an event, you can click Subscribe below the event. For more information about subscription rules, see Subscription Rules tab.
Standard View tab
On the Standard View tab, you can specify filter conditions to search for events. The search results are displayed in the following sections: Heatmap of events in the last two weeks, Event Source Proportion, Trend of Events from Different Sources, and Event Details.
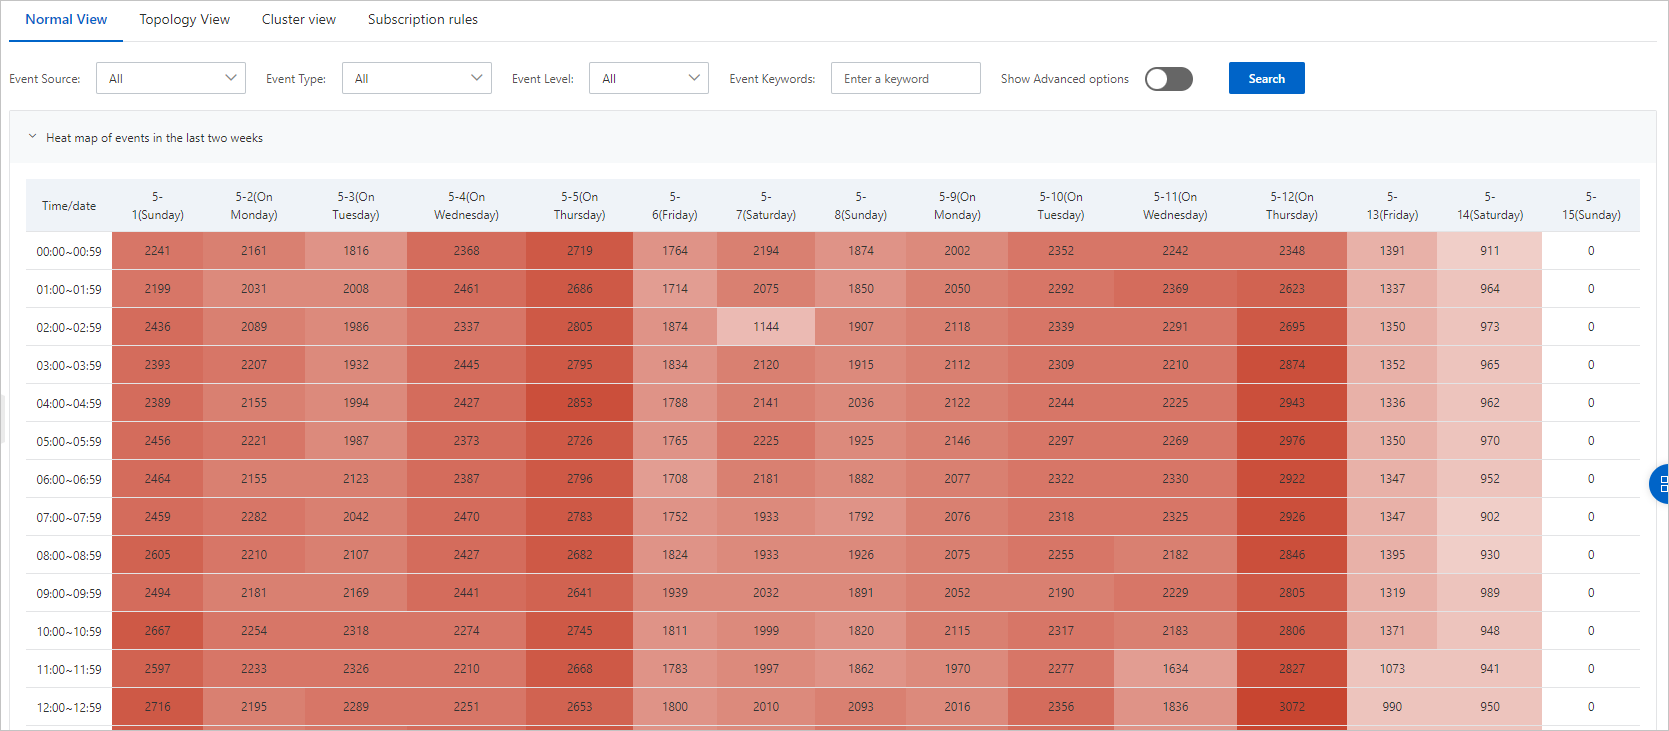
Heatmap of events in the last two weeks: displays the heat map for hourly occurrences of events that meet the filter conditions within the last two weeks. A darker color indicates a larger number of events within the hour.
Event Source Proportion: displays the proportions of events from different sources.
Trend of Events from Different Sources: displays the trends of events from different sources within a specified period of time.
Event Details: displays details of all specified events.
On the Standard View tab, you can perform the following operations:
In the Heatmap of events in the last two weeks section, click each cell to view the event details within the hour.
In the Trend of Events from Different Sources section, click each column to view all the events that occurred in the specified period of time in the Event Details section.
In the Event Details section, click View in the Actions column to view the details of the event.
In the Event Details section, click Subscription in the Actions column to subscribe to the event. For more information, see Subscription Rules tab.
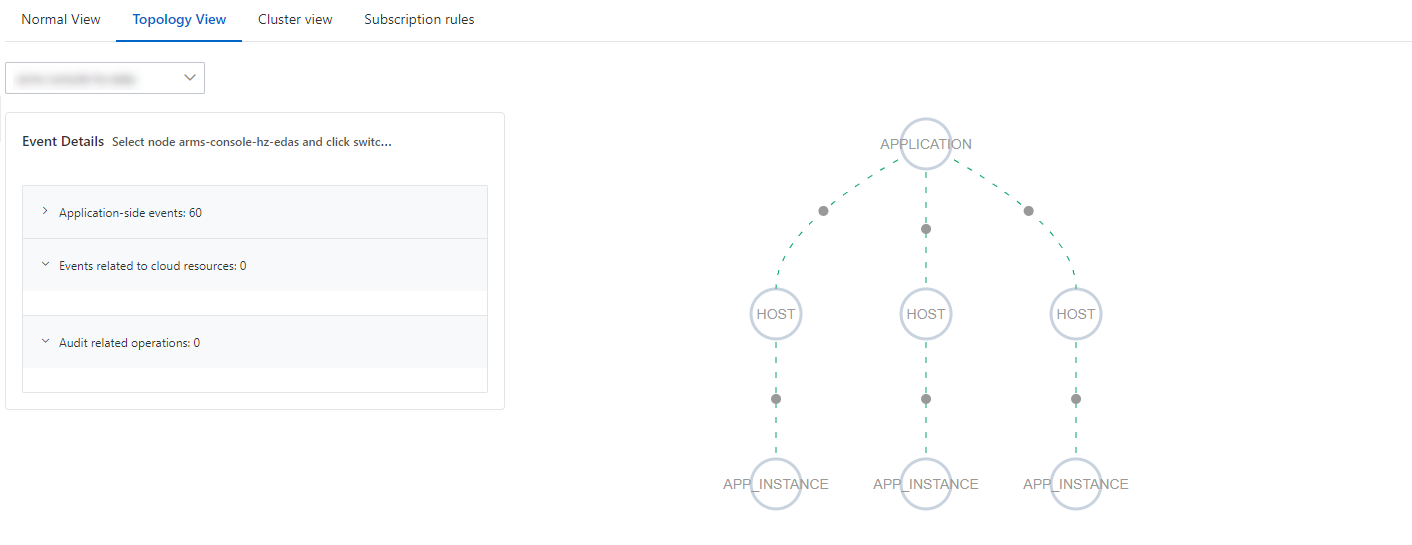
Topology View tab
On the Topology View tab, the system draws the resource topology of the application. The topology includes the following resources: Elastic Compute Service (ECS) instances used by the application, pods on which the application runs, ApsaraDB RDS and ApsaraDB for Redis middlewares used by the application, and Server Load Balancer (SLB) and NAT Gateway resources mounted on the application. After the resource topology is drawn, the system associates the obtained correlated events, ActionTrail events, and CloudMonitor events with topology nodes. You can click a topology node to view the following types of events associated with the node in the Event Details section in the upper-left corner:
Events Related to Applications: the events in the event center.
Events Related to Cloud Resources: the events that CloudMonitor records.
Related ActionTrail Events: the audit records from ActionTrail.
The topology view helps you troubleshoot the associated resources when an application error occurs. For example, in a large enterprise, an employee improperly restarts an ApsaraDB RDS instance in the production environment, which leads to an online service failure. The topology view helps you quickly find out the restart operation on the ApsaraDB RDS instance that is accessed by the application.
Subscription Rules tab
On the Subscription Rules tab, all your existing subscription rules are displayed. You can enable, disable, or modify subscription rules on this tab.
You can modify only the subscription rules that you created in the console. You cannot modify subscription rules that are automatically created by the system.
A subscription rule is used to define the conditions that must be met to subscribe to an event and send the event to a specified webhook. You can use one of the following methods to create a subscription rule:
Method 1: In the upper-right corner of the Subscription Rules tab, click Create Subscription Rule.
Method 2: In the Event Details section of the Standard View tab, click Subscription in the Actions column.
Create a subscription rule on the Subscription Rules tab
Click the Subscription Rules tab. In the upper-right corner of the tab, click Create Subscription Rule.
The Create Subscription Rule panel appears. In the Enter the basic information step, specify Rule Name and Rule Description, and click Next.
In the Select Event Mode step, configure the event rule parameters and click Next.
Parameter
Description
Event Source
Select an event source from the drop-down list.
Event Type
Select an event type from the drop-down list.
Event Level
Select a severity level from the drop-down list.
Event Keywords
Enter event keywords in the field.
Show Advanced Filters
By default, this feature is disabled. After you enable this feature, you can configure filtering options, such as Cluster ID, Associated Application ID, Host IP Address, and Pod Name.
Custom Filter Conditions
A custom filter condition must be met by a field of the JSON event body. The root node of a custom filter condition is data. The root node drills down to a field of the JSON event body by using a period (
.). Enter custom filter conditions. You can enter up to six filter conditions.Select a valid field
Enter a valid field in the
%data.x.y;format and enter an alias for the field. The alias can be used as a placeholder when you enter the POST request body of webhook information. You can enter up to six valid fields.Notification Message Template
Enter a message template. The template content is sent to you when the specified event occurs. If the notification object is the webhook of a DingTalk chatbot, make sure that the message template contains the keyword specified when you created the webhook.
In the Subscription Rule Configuration step, select a contact from the Select Contact drop-down list and click Submit.
If no contact is available in the Select Contact drop-down list, click Create Contact on the right side to create a contact. After a contact is created, select the contact from the Select Contact drop-down list.
Subscribe to an event on the Standard View tab
In the Event Details section of the Standard View tab, find the event that you want to manage and click Subscription in the Actions column.
If you create a subscription rule by using this method, the following filter conditions are automatically selected based on the event: the source, type, and severity level.
In the Select Event Mode step, click the value of a field in the JSON file to specify a custom filter condition and a valid field. A filter condition and a valid field are automatically generated each time you click a field. You can manually modify or delete the fields to adjust the subscription rule. After you configure the parameters in this step, click Next.
In the Subscription Rule Configuration step, select a contact from the Select Contact drop-down list and click Submit.
If no contact is available in the Select Contact drop-down list, click Create Contact on the right side to create a contact. After a contact is created, select the contact from the Select Contact drop-down list.
Common issues
When applications are running in ACK clusters or ACK Serverless (ASK) clusters that are deployed in EDAS, issues may occur due to pods. For more information, see Common pod problems.