The event center aggregates operational events from multiple Alibaba Cloud services into a single view. Instead of switching between consoles, you can monitor, analyze, and respond to changes across your distributed applications from one place.
The event center collects the following event types automatically:
EDAS change events -- deployment, scaling, and configuration changes in Enterprise Distributed Application Service (EDAS)
ARMS alert events -- alerts from Application Real-Time Monitoring Service (ARMS)
Zero-one events -- deadlocks, out-of-memory (OOM) errors, and application startups
MSE governance events -- microservices governance events from Microservices Engine (MSE)
Kubernetes cluster events -- events from the underlying Kubernetes clusters
If your application uses any of these services, the event center collects and displays events without additional setup.
Event model
Each event follows a standard data model. The system uses these fields for grouping, filtering, and subscription rule matching.
| Parameter | Required | Description |
|---|---|---|
| source | Yes | The service or component that generated the event. The Standard View groups events by this field automatically. |
| type | Yes | The event type, such as a change event or alert event. Used as a filter in subscription rules. |
| level | Yes | The severity level of the event. Used to filter events in subscription rules and the Standard View. |
| time | Yes | The timestamp when the event occurred. Used for heatmap and trend visualizations. |
| data | Yes | The event body, typically in JSON format. Fields within the body can be referenced in custom filter conditions using dot notation (for example, data.status.code). |
| PID | No | The Pod ID. Available as an advanced filter in subscription rules. |
| IP | No | The IP address of the host. Available as an advanced filter in subscription rules. |
| ClusterId | No | The cluster ID. Available as an advanced filter in subscription rules. |
| PodName | No | The Pod name. Available as an advanced filter in subscription rules. |
Open the event center
Log on to the EDAS console.
In the left-side navigation pane, choose Application Management > Applications.
In the top navigation bar, select a region.
In the upper part of the page, select a microservices namespace from the Microservices Namespace drop-down list.
Select Kubernetes Cluster from the Cluster Type drop-down list.
Click the name of the application that you want to manage.
In the left-side navigation pane, click Event Center.
Page layout
The Event Center page contains four sections:
| Section | Purpose |
|---|---|
| Typical events | Displays the count of preset event types over the last 30 minutes at a glance. |
| Standard View tab | Filters and analyzes all events associated with the application across multiple dimensions. |
| Topology View tab | Maps events onto the resource topology of the application for cross-resource troubleshooting. |
| Subscription Rules tab | Lists subscription rules that send event notifications to webhooks. |
View and filter events
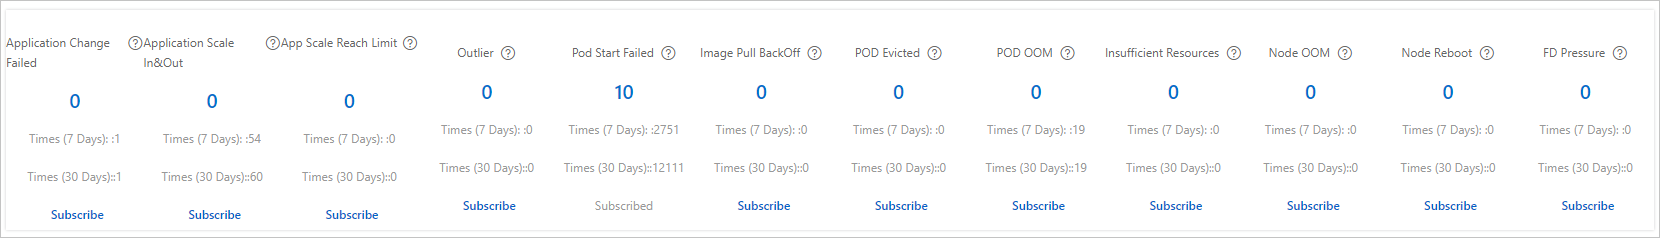
Typical events
The typical events section displays the number of occurrences for each preset event type within the last 30 minutes. To change the time range, use the date and time picker in the upper-right corner.
To subscribe to a specific event type, click Subscribe below that event. For details, see Create a subscription rule.
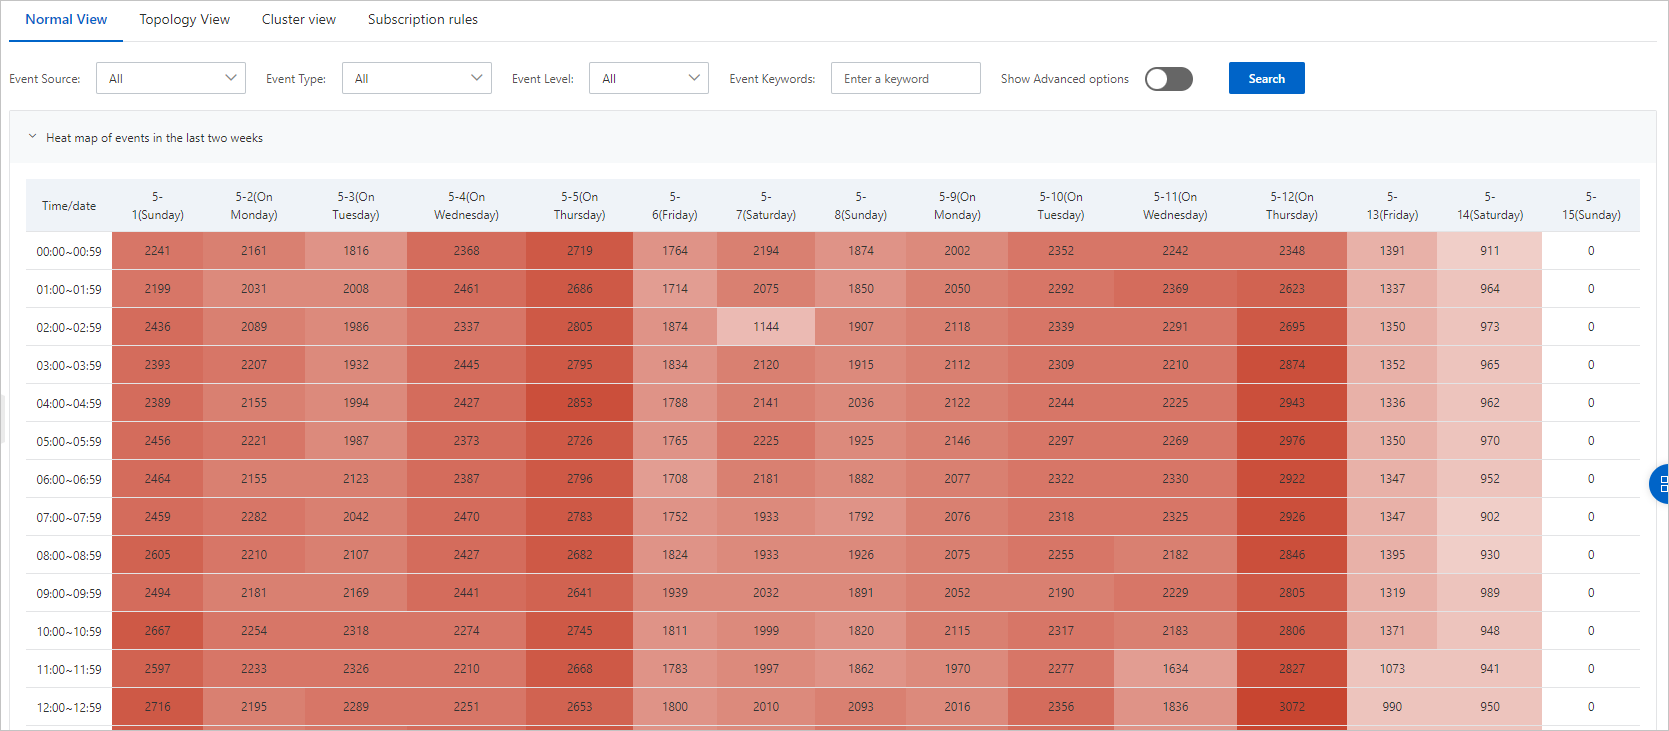
Standard View tab
The Standard View tab displays filtered events across four analysis dimensions:
Heatmap of events in the last two weeks -- Displays hourly event counts as a heatmap. Darker cells indicate more events in that hour. Click any cell to view the event details for that hour.
Event Source Proportion -- Shows the distribution of events across different sources as a pie chart.
Trend of Events from Different Sources -- Shows event volume trends from each source over time. Click any column to view the corresponding events in the Event Details section.
Event Details -- Lists individual events with their details. Click View in the Actions column to inspect an event, or click Subscription to create a subscription rule based on that event.
Use the filter controls at the top of the tab to narrow results by event source, type, severity level, or keywords.
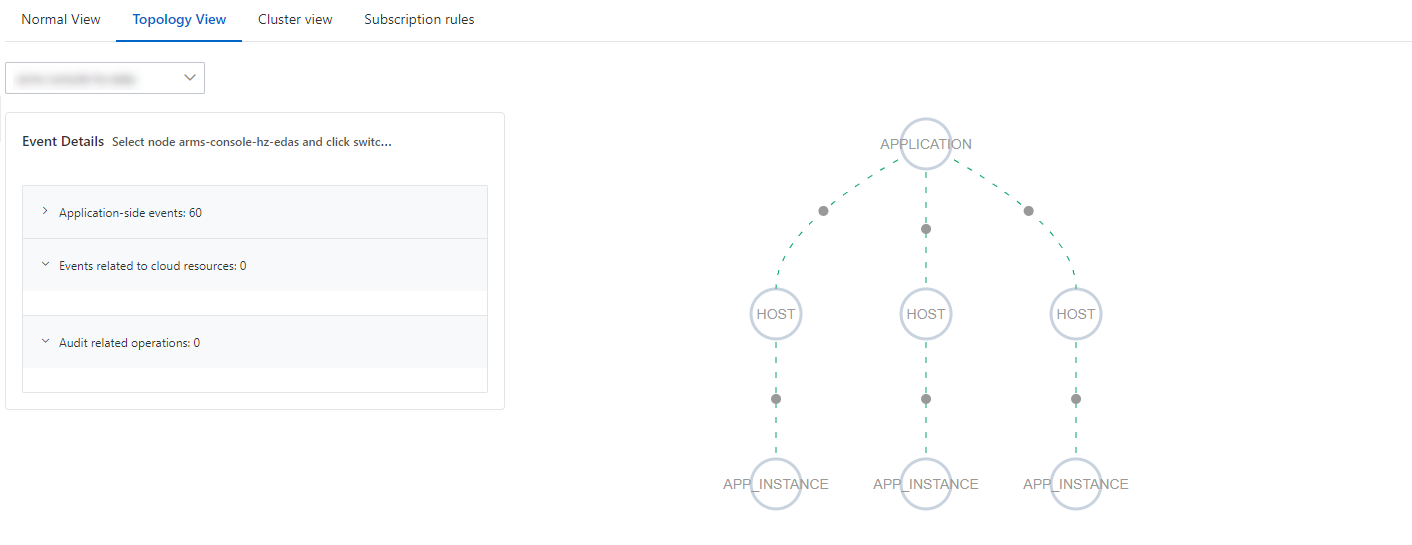
Topology View tab
The Topology View tab maps your application's resource topology and overlays events onto each resource node. The topology includes:
Elastic Compute Service (ECS) instances
Pods
ApsaraDB RDS and ApsaraDB for Redis instances
Server Load Balancer (SLB) and NAT Gateway resources
Click any topology node to view three categories of events in the Event Details panel:
| Category | Source |
|---|---|
| Events Related to Applications | Events collected by the event center |
| Events Related to Cloud Resources | Events recorded by CloudMonitor |
| Related ActionTrail Events | Audit records from ActionTrail |
Troubleshooting with the topology view
The topology view links application-level events to the underlying infrastructure, so you can trace a service outage to its root cause from a single page.
Example scenario: An ApsaraDB RDS instance accessed by your application is unexpectedly restarted by a team member, causing a service outage. In the topology view, you can:
Click the RDS node in the topology to see its associated events.
Open the Related ActionTrail Events tab to find the restart operation and identify who performed it.
Correlate the restart timestamp with the application error events to confirm the root cause.
Create a subscription rule
Subscription rules define the conditions under which the event center sends notifications to a specified webhook. The Subscription Rules tab lists all existing rules. From this tab, you can enable, disable, or modify rules as needed.
Only subscription rules that you created in the console can be modified. Rules that are automatically created by the system are read-only.
You can create a subscription rule using either of these methods:
From the Subscription Rules tab -- Click Create Subscription Rule in the upper-right corner.
From the Standard View tab -- In the Event Details section, click Subscription in the Actions column for a specific event. This auto-populates the event source, type, and severity level from the selected event.
Step 1: Enter basic information
Specify Rule Name and Rule Description, then click Next.
Step 2: Configure event filters
Configure the following parameters to define which events trigger the rule.
| Parameter | Description |
|---|---|
| Event Source | Select an event source from the drop-down list. |
| Event Type | Select an event type from the drop-down list. |
| Event Level | Select a severity level from the drop-down list. |
| Event Keywords | Enter keywords to match against event content. |
| Show Advanced Filters | Disabled by default. Enable to filter by Cluster ID, Associated Application ID, Host IP Address, or Pod Name. |
| Custom Filter Conditions | Filter on specific fields within the JSON event body. The root node is data, and you drill down using dot notation. For example, to filter by a status code field, enter data.status.code. Up to six conditions are supported. |
| Select a valid field | Extract fields from the event body for use as placeholders in the notification template. Use the format %data.x.y; and assign an alias. Up to six fields are supported. |
| Notification Message Template | Define the message content sent when the event occurs. If the notification target is a DingTalk chatbot webhook, the template must contain the keyword specified when the webhook was created. |
Click Next after configuring the filters.
Step 3: Select a contact
Select a contact from the Select Contact drop-down list, then click Submit.
If no contacts are available, click Create Contact to add one. After the contact is created, select it from the drop-down list.
Subscribe to an event from the Standard View tab
In the Event Details section of the Standard View tab, find the target event and click Subscription in the Actions column. The event source, type, and severity level are auto-populated.
In the Select Event Mode step, click field values in the JSON body to auto-generate custom filter conditions and valid fields. Modify or delete these as needed, then click Next.
In the Subscription Rule Configuration step, select a contact from the Select Contact drop-down list and click Submit. If no contacts are available, click Create Contact to add one first.
Common issues
For Pod-related issues in ACK clusters or ACK Serverless (ASK) clusters deployed in EDAS, see Common Pod problems.