When response times spike or request success rates drop, you need immediate notification to troubleshoot. Enterprise Distributed Application Service (EDAS) integrates with Application Real-Time Monitoring Service (ARMS) to collect application metrics and trigger alerts based on conditions you define.
The following example walks through creating two alert rules for a Java application called user-service, deployed in a Container Service for Kubernetes (ACK) cluster and monitored by EDAS. The two rules monitor:
Average response time of API requests to the application's services
Success rate of API requests to the application's services
Prerequisites
Before you begin, make sure that your application is connected to ARMS for monitoring. For details, see Application Monitoring overview.
Verify that your application is monitored
Before you create alert rules, confirm that EDAS is collecting data for the target application.
Log on to the EDAS console.
In the left-side navigation pane, choose Application Management > Applications.
On the Applications page, find the
user-serviceapplication and click the application name.In the left-side navigation pane, choose Application Monitoring > Application Overview.
On the Application Overview page, check whether monitoring data is displayed.
If data appears, the application is monitored. Proceed to the next section.
If no data appears, enable application monitoring for the application first.
The user-service application in this example is a Java application deployed in an ACK cluster. The information displayed on the Application Overview page varies by application type.
Create the alert rules
This example creates two alert rules. Alert notifications are sent through text messages, emails, or DingTalk group messages. The two rules use the following conditions:
| Alert rule | Condition | Threshold | Evaluation window |
|---|---|---|---|
| Response time alert | Average response time of API requests >= threshold | 500 ms | Previous 3 minutes |
| Success rate alert | Success rate of API requests <= threshold | 90% | Previous 3 minutes |
Response time and success rate may fluctuate briefly without affecting core business. To reduce false alarms, each rule uses a 3-minute evaluation window -- the alert fires only if the condition persists for the full window. Adjust these thresholds and windows based on your requirements.
Open the alert rule creation page
Log on to the EDAS console.
In the left-side navigation pane, click Application Management > Applications. In the top navigation bar, select a region. In the upper part of the page, select a namespace. Select Container Service or Serverless Kubernetes Cluster from the Cluster Type drop-down list. Then, find the target application and click the application name.
In the left-side navigation pane, choose Alert Management > Alert Rule.
In the upper-right corner of the Application Monitoring Alert Rules page, click Create Application Monitoring Alert Rule.
On the Create Application Monitoring Alert Rule page, set the following parameters:
Parameter Value Select Applications user-serviceMetric Type Invocation_Type
Configure the response time alert rule
On the Create Application Monitoring Alert Rule page, enter a name for the alert rule and set the trigger condition to: average response time of API requests >= 500 ms over the previous 3 minutes.
Specify a notification policy:
If a notification policy already exists, select it from the Notification Policy drop-down list.
If no notification policy exists, complete the next step to create one. Then click the Refresh icon next to the Notification Policy drop-down list and select the newly created policy.
(Optional) Create a notification policy.
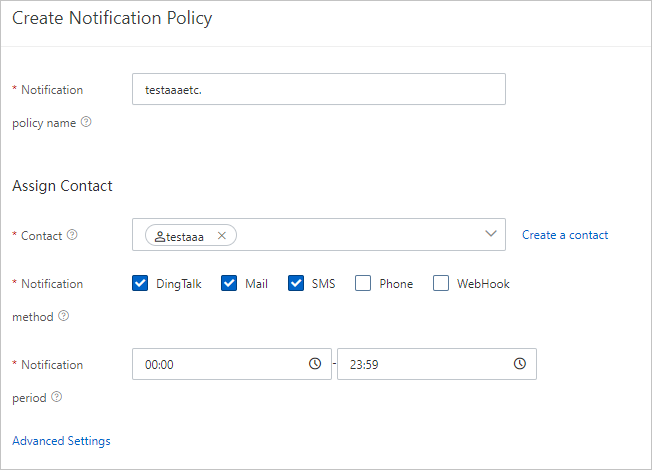
Click Quickly create notification policies next to the Notification Policy drop-down list. In the Quickly create notification policies panel, configure the parameters and click Confirm.
If a contact already exists, select the contact from the Contact drop-down list.
If no contact exists, complete the next step to create one. Then reopen the Quickly create notification policies panel and select the newly created contact.
(Optional) Create contacts and notification channels.
Click Create Contact next to the Contact drop-down list. On the page that appears, set up contacts, contact groups, and DingTalk group notifications:
Create a contact:
On the Contact tab, click Create Contact.
In the Create Contact dialog box, configure the parameters and click OK.
Create a contact group:
On the Contact Group tab, click Create Contact Group in the upper-right corner.
In the Create Contact Group dialog box, enter a group name, add the contact you created, and click OK.
After creation, the contact group appears on the Contact Group tab.
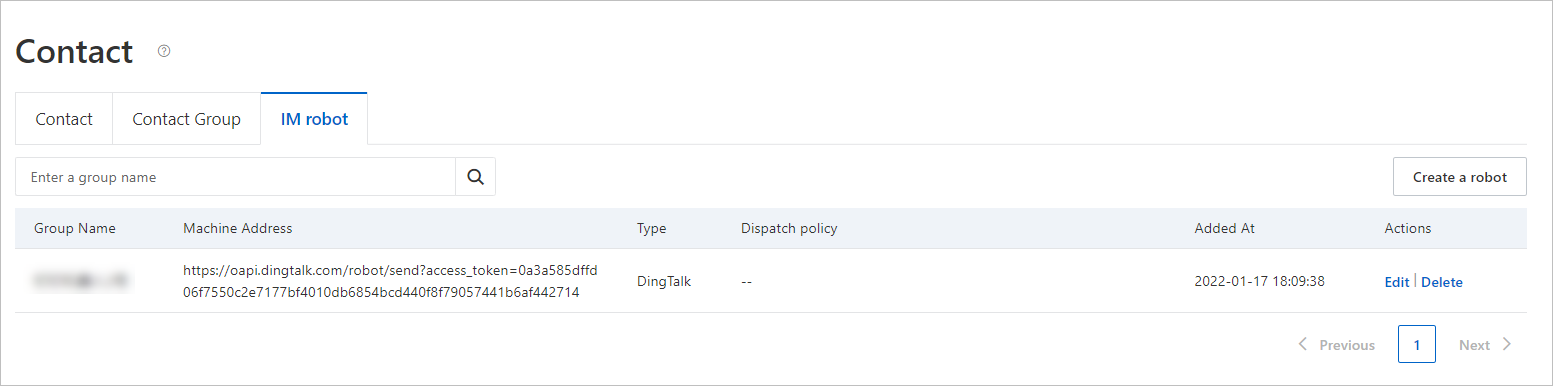
Add a DingTalk group:
On the IM robot tab, click Create a robot in the upper-right corner.
In the Create a robot dialog box, configure the DingTalk group parameters and click OK.
After you add the DingTalk group, it appears on the IM robot tab.
Click Save.
Configure the success rate alert rule
Repeat the preceding steps to create the success rate alert rule. Set the trigger condition to: success rate of API requests <= 90% over the previous 3 minutes.
Verify the alert rules
To confirm that both rules were created, choose Alert Management > Alert Rule in the left-side navigation pane. Both alert rules should appear in the list.
View alert history
After alert notifications are triggered, review them on the alert history page.
Log on to the EDAS console.
In the left-side navigation pane, click Application Management > Applications. In the top navigation bar, select a region. In the upper part of the page, select a namespace. Select Container Service or Serverless Kubernetes Cluster from the Cluster Type drop-down list. Then, find the target application and click the application name.
In the left-side navigation pane, choose Alert Management > Alert sending History.
The Alert page lists all alert notifications and the time each was sent.
For details, see View alert records.