When an Enterprise Distributed Application Service (EDAS) application triggers an alert, the Alert page is your starting point for investigation. From this page, you can review what happened, identify the root cause, and take action to resolve the issue.
The Alert page supports the following tasks:
Filter alerts by name, status, severity, handler, or time range to locate specific incidents.
View alert details, related events, and notification history.
Claim, reassign, or resolve alerts directly from the console.
Prerequisites
Before you begin, make sure that you have:
An Alibaba Cloud account that activated EDAS after 00:00:00 on April 30, 2021 (the alert management feature is unavailable for accounts that activated EDAS before this date)
Open the alert records page
Log on to the EDAS console.
In the left-side navigation pane, click Application Management > Applications.
In the top navigation bar, select a region. In the upper part of the page, select a namespace.
Select Container Service or Serverless Kubernetes Cluster from the Cluster Type drop-down list.
Find the target application and click the application name.
In the left-side navigation pane, choose Alert Management > Alert sending History. The Alert page displays all alert records for the application.
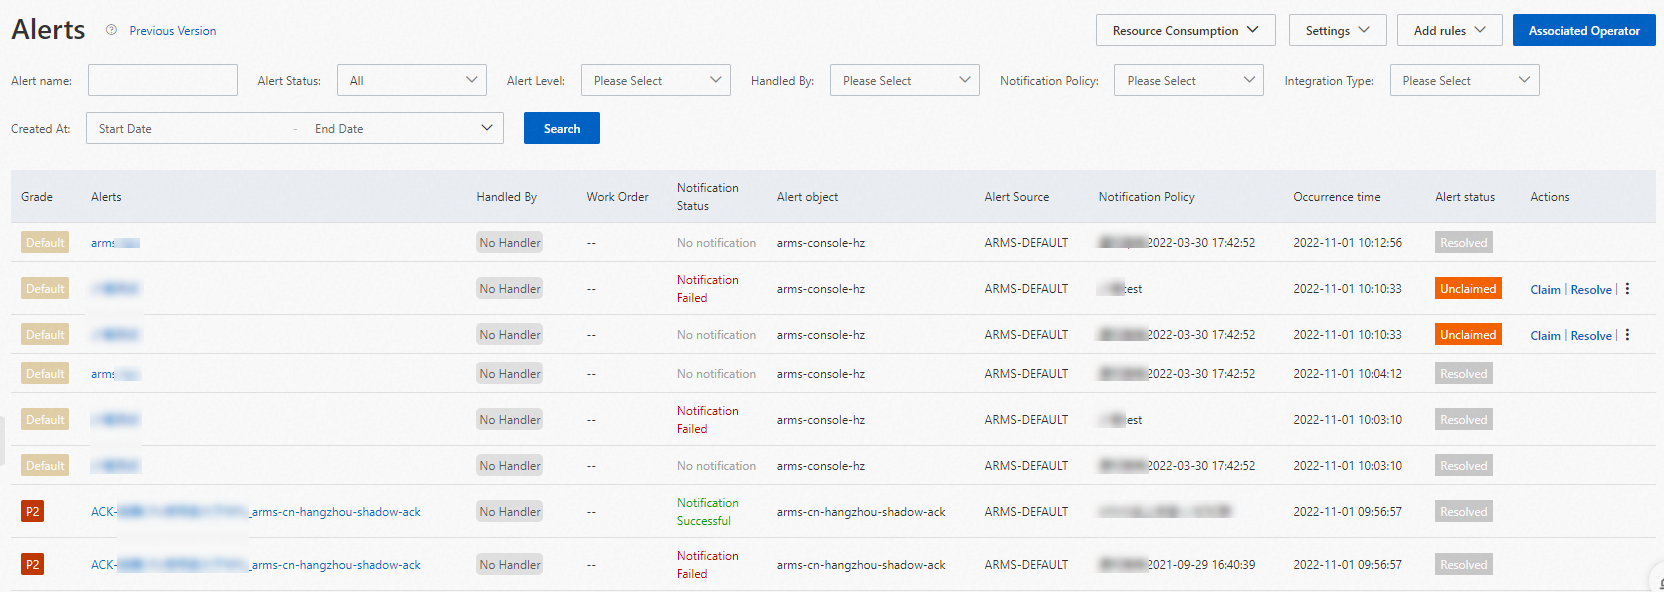
Filter and search alerts
To narrow down the alert list, specify one or more filter conditions and click Search.
| Parameter | Description |
|---|---|
| Alert Name | The name of the alert rule that triggered the alert. |
| Alert Status | The current state of the alert. Valid values: To Be Claimed, Processing, Resolved. |
| Alert Level | The severity of the alert. Valid values: Default, P1, P2, P3, P4, P5. |
| Handled By | The user assigned to handle the alert. |
| Notification Policy | The notification policy configured for the alert. |
| Integration Type | The type of service integration that reported the alert event. |
| Created At | The time range during which the alert was generated. |
Alert severity is configurable only when you create alert rules for Prometheus Service. For application monitoring and frontend monitoring, the severity is fixed at Default.
View alert details
Click an alert name to open the alert details page. This page shows the severity, notification content, and current status of the alert.
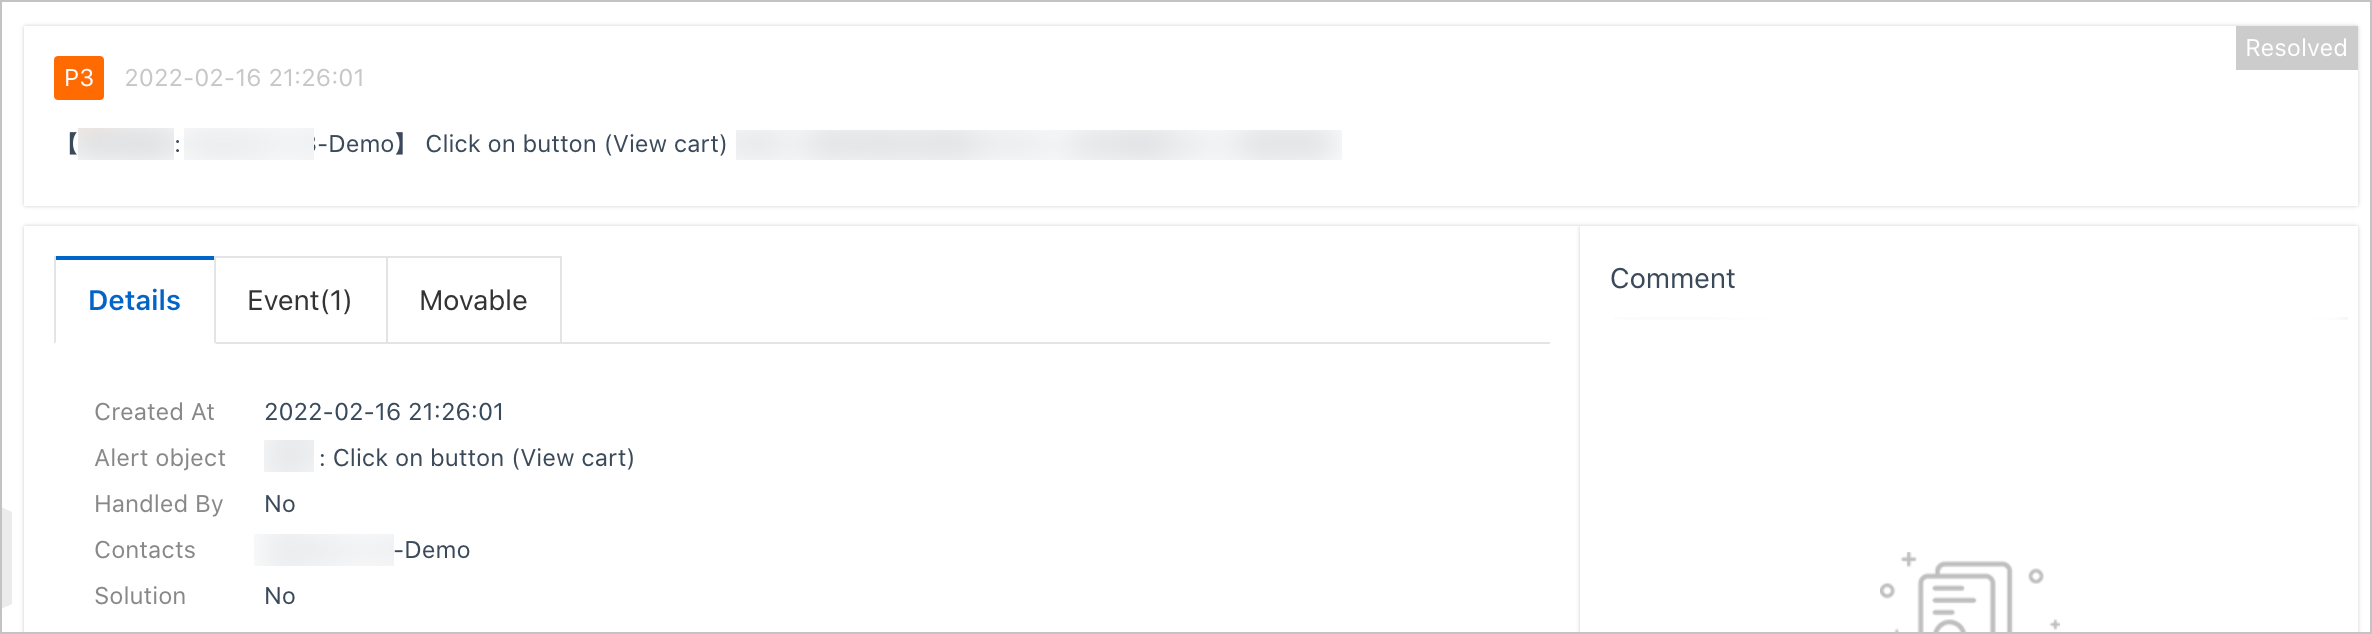
The details page contains three tabs:
Details tab
The Details tab shows:
The time when the alert was generated
The object that triggered the alert rule
The user handling the alert
The recipients of alert notifications
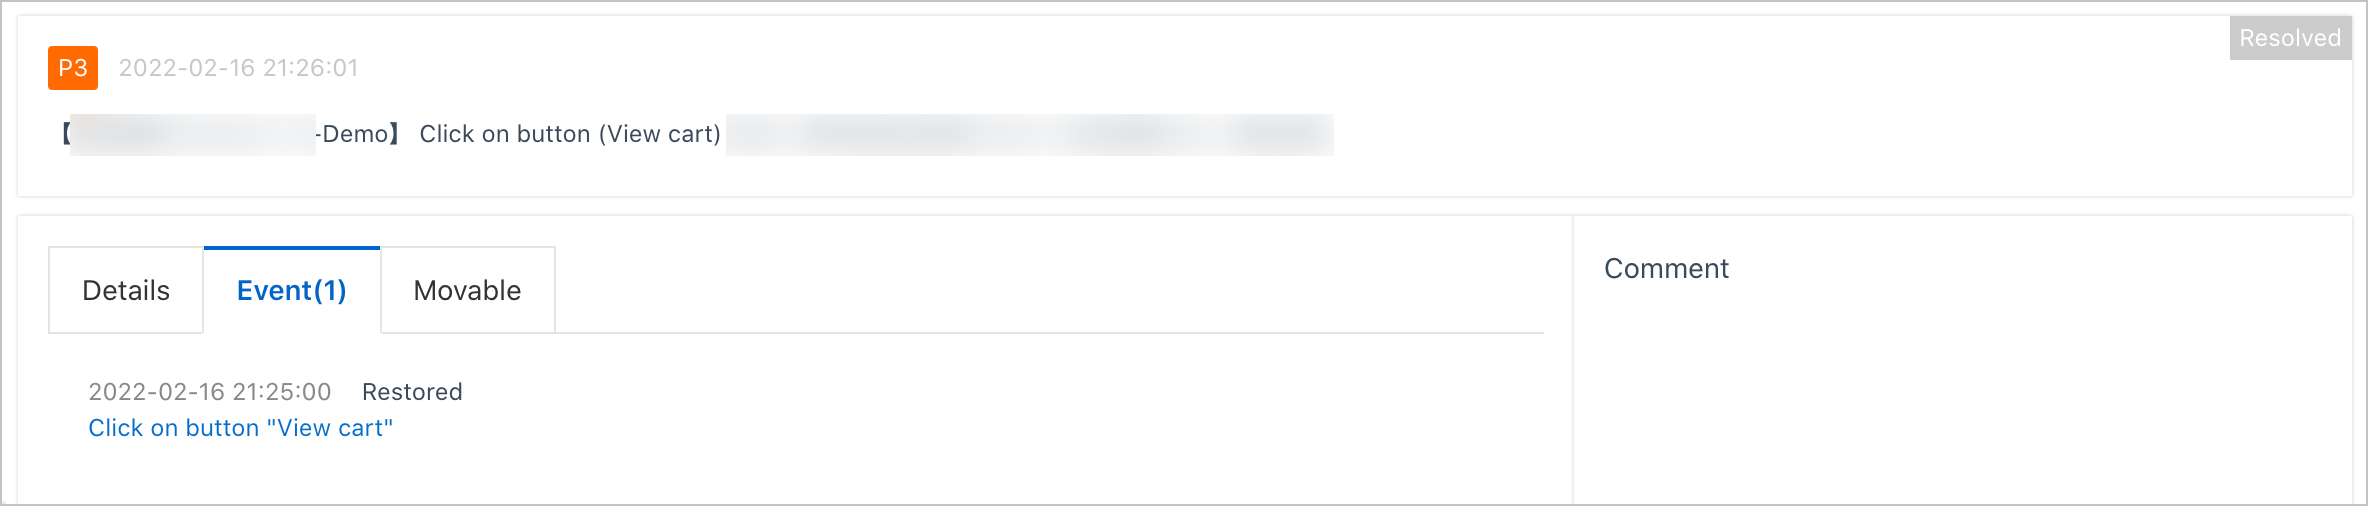
Event tab
The Event tab lists all events related to the alert, including the time and status of each event. Click an event name to view event details. For more information, see View event details.
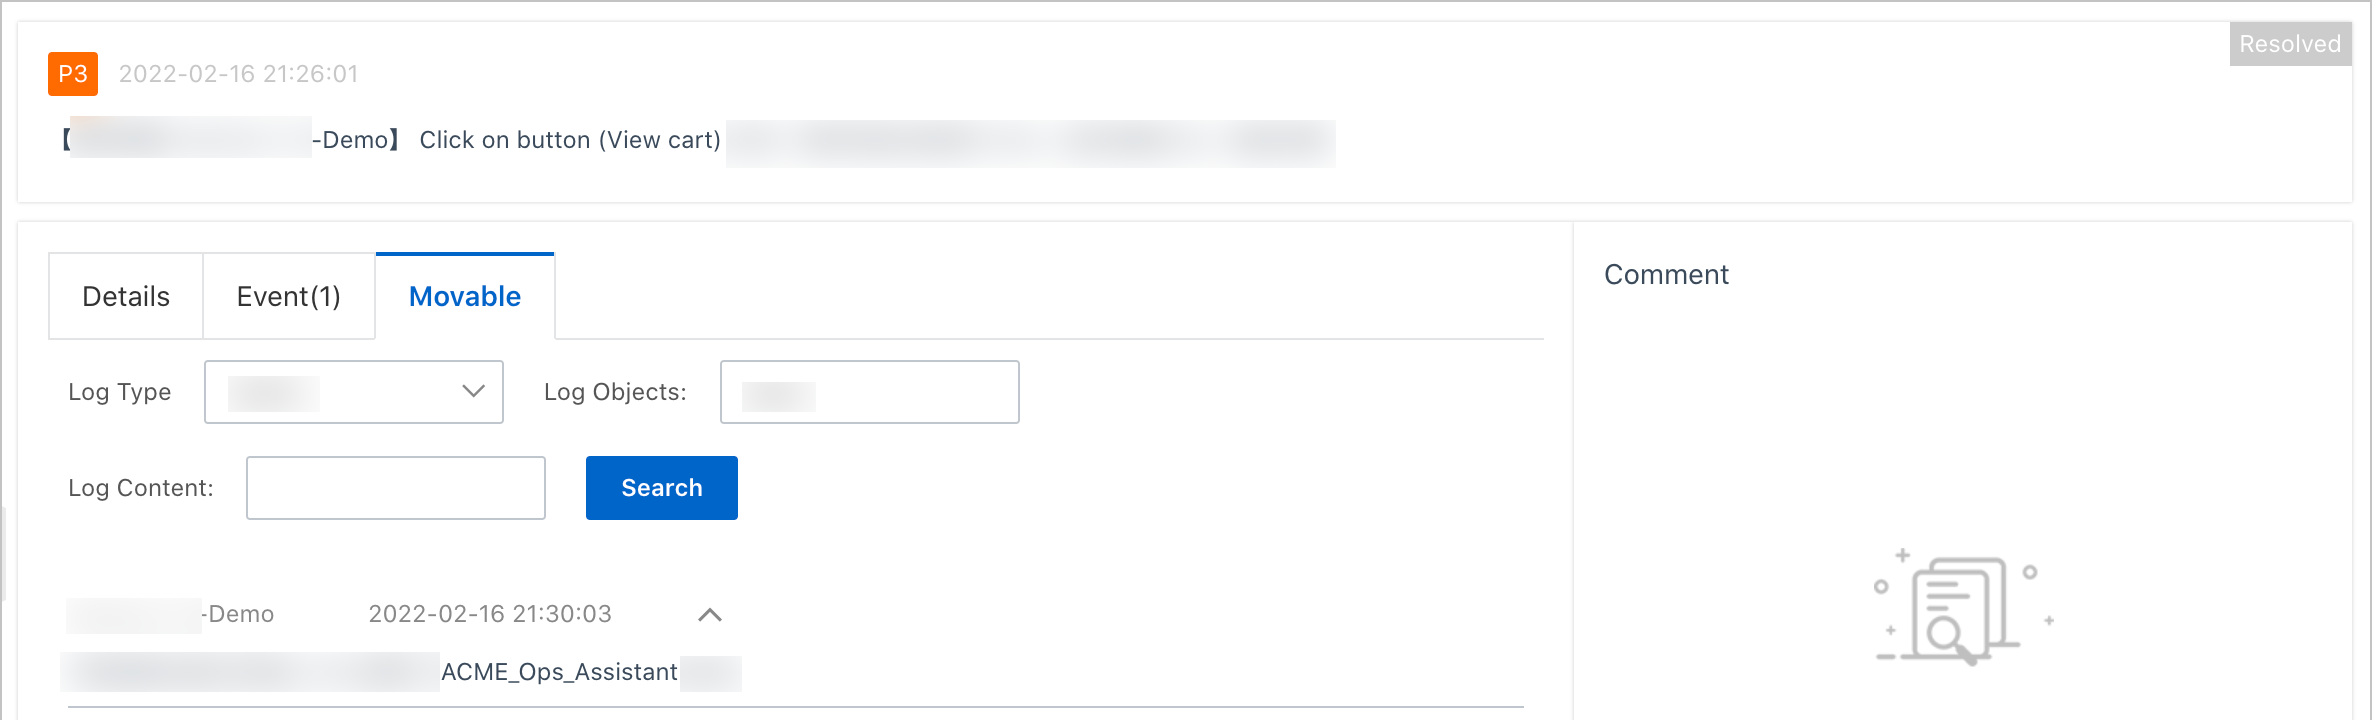
Movable tab
The Movable tab shows the notification activity history for the alert, including when and how notifications were sent.
View event details
On the Event tab, click an event name to open the Event Details panel. This panel shows the basic information, monitoring data, and extended fields of the alert event.
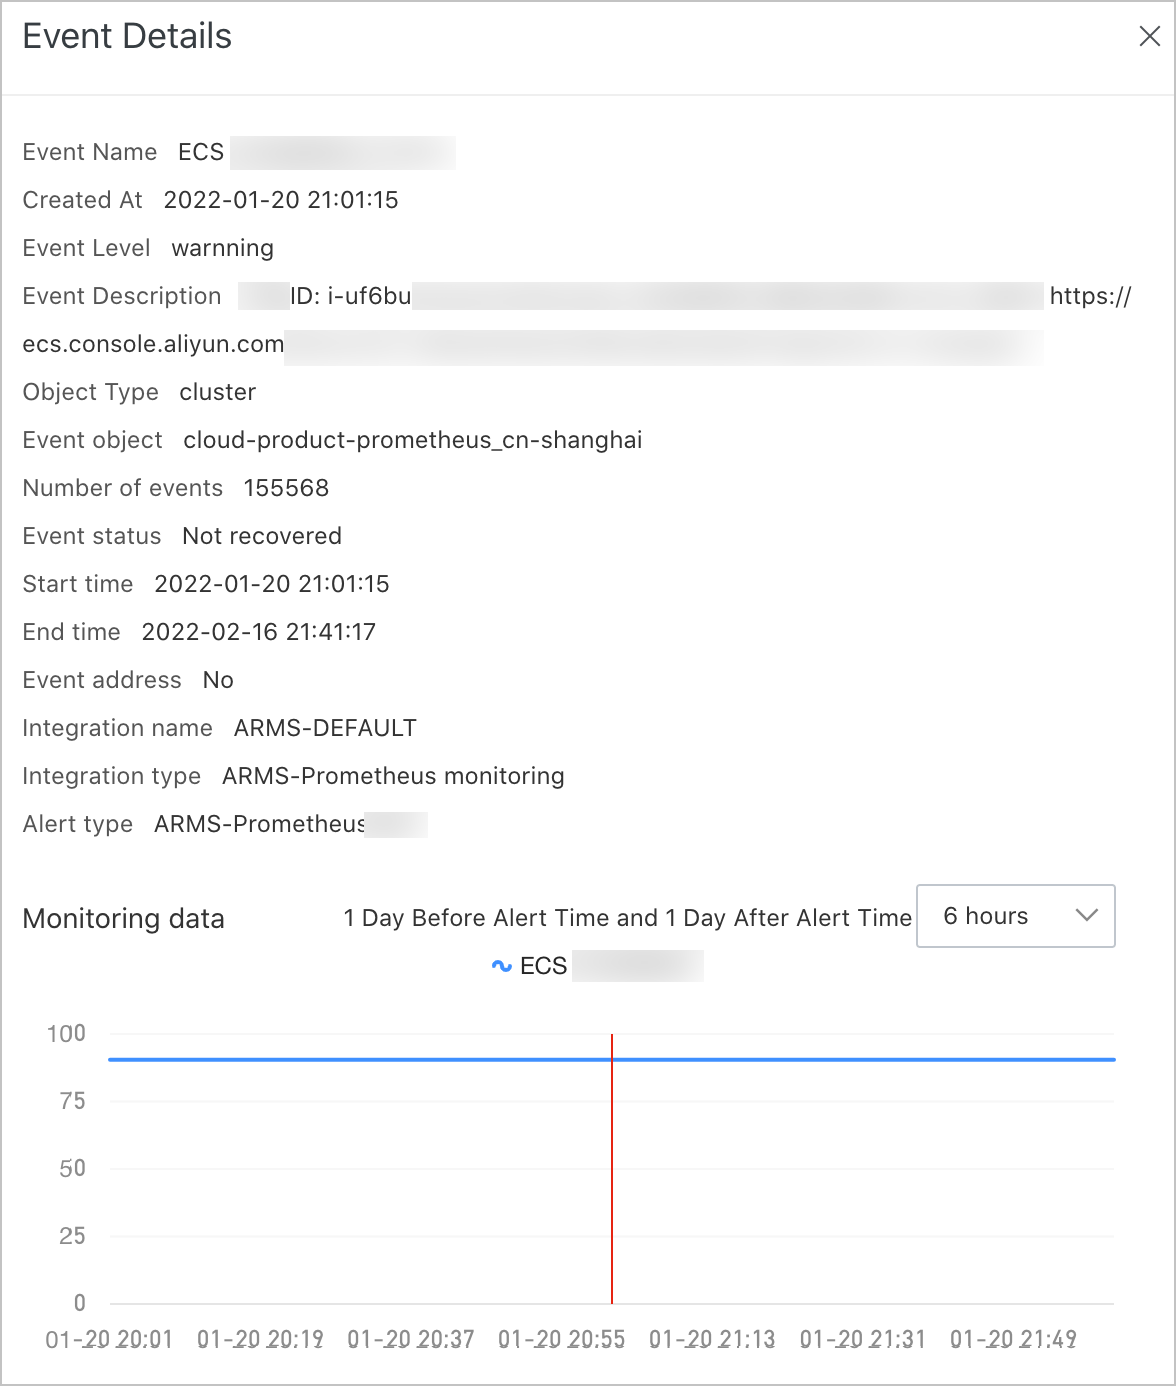
Monitoring data
The Monitoring data section displays data before and after the alert was triggered.
Select a time window from the drop-down list (6 hours, 12 hours, or 24 hours) to adjust the data range.
Drag the pointer on the chart to zoom into a specific time range. Click Reset to return to the original view.
Handle alerts
EDAS tracks each alert through three states:
| Status | Description |
|---|---|
| To Be Claimed | The alert is new and has not been claimed. |
| Processing | A user has claimed the alert and is investigating. |
| Resolved | The processing of the alert has ended. |
To Be Claimed is the initial state set by the system when an alert fires. The other two states are set by users through manual actions.
Link a DingTalk account (first time only)
Before you can handle alerts, associate your contact information with a DingTalk account:
Open the DingTalk group where alert notifications are sent. Click View details in the alert card.
If this is your first time viewing alert information in the DingTalk group, the Binding mobile phone number dialog box appears. Enter your phone number and click Send Verification Code.
Enter the verification code and click OK.
Claim, resolve, or reassign an alert
Log on to the EDAS console.
Navigate to the Alert sending History page as described in Open the alert records page.
In the upper-right corner of the Alert page, click Associated Operator.
In the Actions column of the alert, or from the alert details page, perform any of the following operations:
Action Description Claim Assigns the current account as the alert handler. Resolve Ends the processing of the alert. Specify Alert Handler (under the More icon) Reassigns the alert to another contact in the DingTalk group. Modify Alert Level (under the More icon) Changes the severity level of the alert.