View service metrics
E-MapReduce (EMR) automatically collects service metrics for your clusters and syncs them to CloudMonitor. You can view key service metrics in the E-MapReduce console, and configure threshold alerts or create custom dashboards in the CloudMonitor console.
Prerequisites
A cluster is created. For more information, see Create a cluster.
View metrics in the E-MapReduce console
-
Navigate to the Metric Monitoring page.
-
Log on to the E-MapReduce console.
-
In the top navigation bar, select a region and resource group.
-
On the EMR on ECS page, click the name of the target cluster.
-
Click the Monitoring and Diagnostics tab.
-
Click the Metric Monitoring tab.
-
-
On the Metric Monitoring page, select a service dashboard from the Dashboard drop-down list.
For example, the available dashboards for the YARN service include YARN-HOME, YARN-GCAnalysis, YARN-Queues, YARN-ResourceManager, YARN-NodeManagers, YARN-JobHistory, and YARN-TimeLineServer.
You can perform the following operations:
-
View metric definitions: Hover over the
 icon for a metric to view its definition.
 -
View metrics by node: To view metrics for an individual node, select it from the host drop-down list. You can also use the nodeGroupId drop-down list to switch between node groups.
-
View metrics by time range: In the upper-right corner, select a time window. You can use the quick-select buttons (1 Hour, 3 Hours, 6 Hours, 12 Hours, 1 Day, 7 Days) or define a custom start and end time.
-
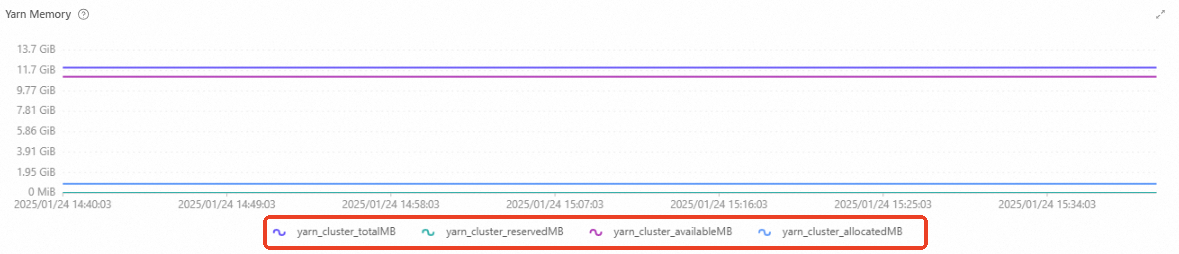
Select metrics to display: When a chart shows multiple metrics, you can click the metric names at the bottom of the chart to show or hide them.
-
View metrics in the CloudMonitor console
-
On the Metric Monitoring page, click View More Metrics to open the service dashboard in CloudMonitor, which displays metrics synced from E-MapReduce.
-
To create alerts for EMR cluster metrics in CloudMonitor, see Create a threshold alert rule.
-
If the default charts do not meet your needs, you can create a custom dashboard. For more information, see Monitoring charts on a custom dashboard.
Subscribe to metric alerts
-
On the Metric Monitoring page, click Subscribe to Metric Alerts to navigate to the alert rule page in CloudMonitor, where you can configure alerts for metrics synced from E-MapReduce.
-
For example, you can configure an alert in CloudMonitor to send you an SMS message immediately if the HDFS storage usage exceeds 80%. For instructions, see Create a threshold alert rule.