This topic describes how to access the Kubernetes Dashboard UI and Grafana UI.
Prerequisites
An E-MapReduce (EMR) Data Science cluster is created, and Kubeflow is selected from the optional services when you create the cluster. For more information, see Create a cluster.
Ports 32699 and 31808 are enabled. For more information, see Manage security groups.
ImportantWhen you configure the authorization object in the security group rule, enter only the CIDR blocks or IP addresses that need to access Kubernetes. Do not enter the CIDR block 0.0.0.0/0.
Access the Kubernetes Dashboard UI
Go to the Cluster Overview page of your cluster.
Log on to the EMR console. In the left-side navigation pane, click EMR on ECS.
In the top navigation bar, select the region where your cluster resides and select a resource group based on your business requirements.
On the EMR on ECS page, find the cluster that you want to scale out and click Nodes in the Actions column.
In the Nodes page, find the destination master node group and click the
 icon.
icon. Open your browser, enter http://<yourPublicIPAddress>:32699 in the address bar, and then press Enter.
NoteReplace <yourPublicIPAddress> with the public IP address that you obtained in Step 2.
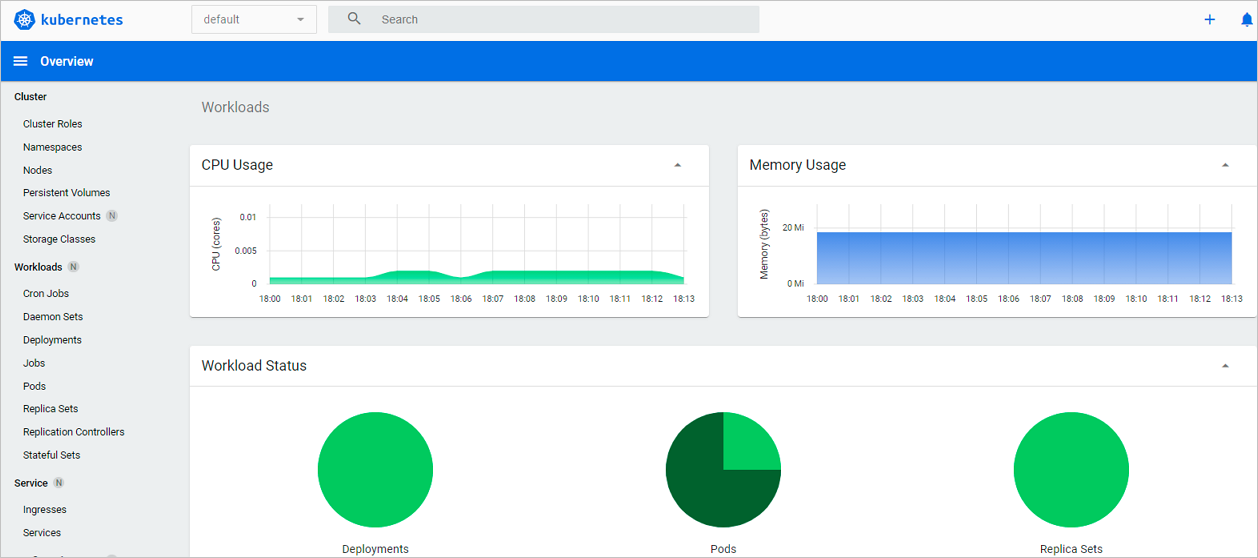
The page shown in the following figure appears.
Access the Grafana UI
Only EMR V3.35.7 or later supports access to the Grafana UI.
Go to the Cluster Overview page of your cluster.
Log on to the EMR console. In the left-side navigation pane, click EMR on ECS.
In the top navigation bar, select the region where your cluster resides and select a resource group based on your business requirements.
On the EMR on ECS page, find the cluster that you want to scale out and click Nodes in the Actions column.
In the Nodes page, find the destination master node group and click the
icon. Open your browser, enter http://<yourPublicIPAddress>:31808 in the address bar, and then press Enter.
NoteReplace <yourPublicIPAddress> with the public IP address that you obtained in Step 2.
The default username and password are both admin.
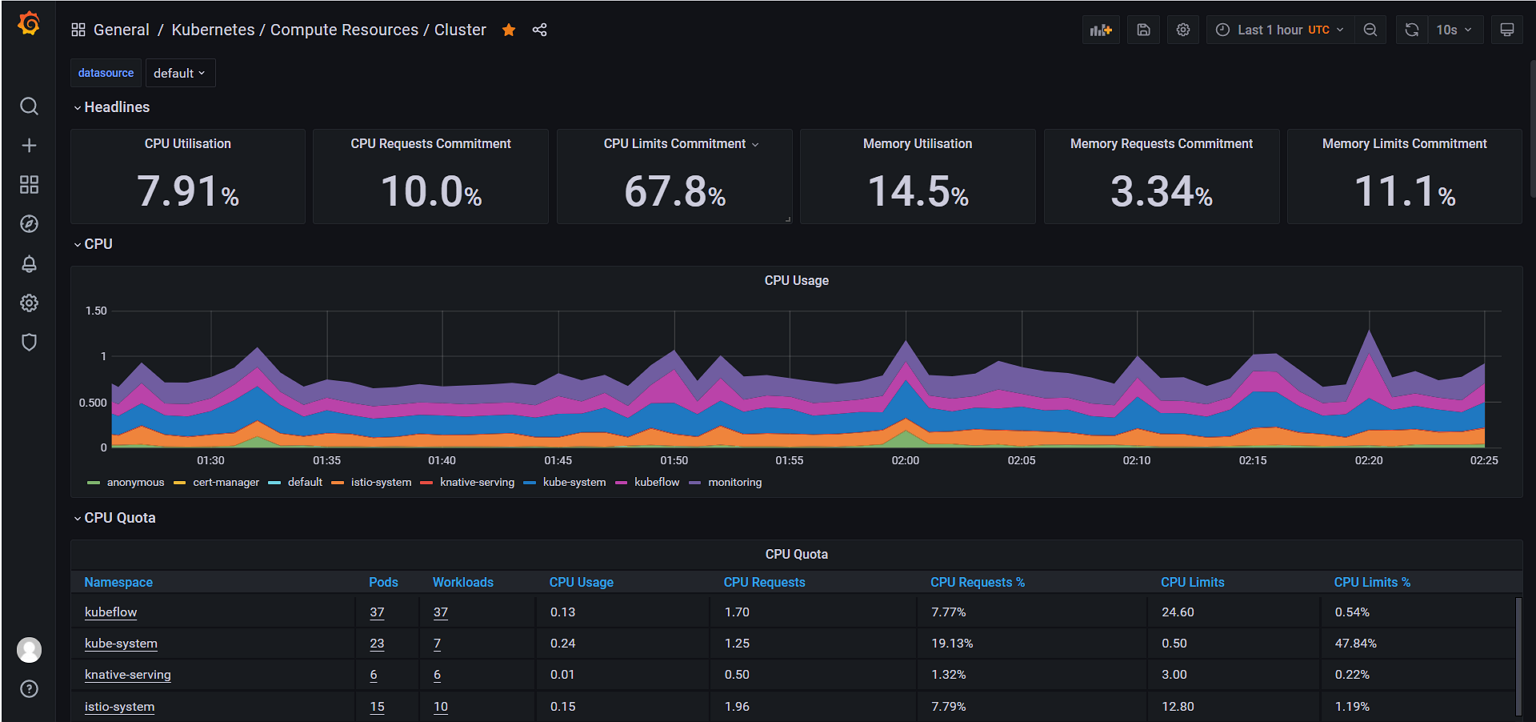
In the top navigation bar of the page that appears, click General.
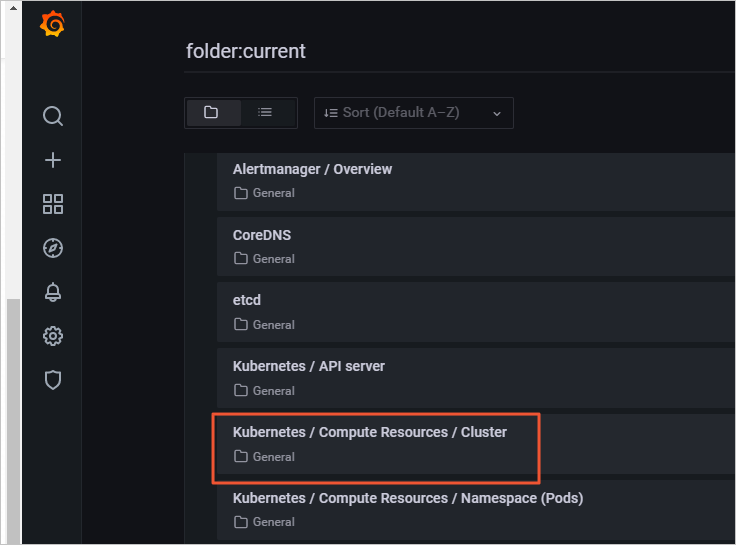
Click Kubernetes/Compute Resources/Cluster.
You can configure alert rules and view the usage of cluster resources on the Grafana UI.