Alibaba Cloud Logstash allows you to monitor Logstash clusters and configure custom alert rules and notification methods for Logstash clusters. To ensure the stability of your Logstash cluster, we recommend that you configure monitoring and alerting for the cluster. This way, the system can monitor items, such as cluster status and disk usage, in real time. We also recommend that you check notifications that are sent to you by text message and take appropriate measures to resolve issues at the earliest opportunity. This topic describes how to configure a custom alert policy for a Logstash cluster.
Procedure
Go to the Create Alert Rule panel of the CloudMonitor console.
Log on to the Alibaba Cloud Elasticsearch console.
In the top navigation bar, select the region where the cluster resides.
In the left-side navigation pane, click Logstash Clusters. On the Logstash Clusters page, find the cluster and click its ID.
In the left-side navigation pane of the page that appears, click Cluster Monitoring.
In the Monitoring and Alerting Configuration section, click Go to CloudMonitor. The Create Alert Rule panel of the CloudMonitor console appears.
In the Create Alert Rule panel, configure the parameters to create a custom alert rule.
The following table describes the settings of the parameters in this example. Retain the default settings of the parameters that are not described in the table. For more information about the parameters, see Create an alert rule.
Parameter
Description
Product
Select Logstash from the drop-down list.
Resource Range
Select Instances.
Associated Resources
Select the Logstash cluster.
Rule Description
Click Add Rule and select Combined Metrics.
In the Configure Rule Description panel, specify a rule name in the Alert Rule field and configure the following parameters:
Metric Type: Select Combined Metrics.
Alert Level: Select Warning (Warn) from the drop-down list.
Multi-metric Alert Condition: Specify multiple metrics.
Relationship Between Metrics: Select Generate alerts if one of the conditions is met (||).
Alert Threshold Triggers: Select 3 Consecutive Cycles (1 Cycle = 1 Minutes).
Alert Contact Group
Select the alert contact group that you created. For information about how to create an alert contact group, see Create an alert contact or alert contact group.
You can also click Advanced Settings and enter a URL that can be accessed over the Internet in the Alert Callback field. This way, CloudMonitor can push alert notifications to the URL through a POST request. Only HTTP requests are supported. For more information, see Use the alert callback feature to send notifications about threshold-triggered alerts.
Click Confirm.
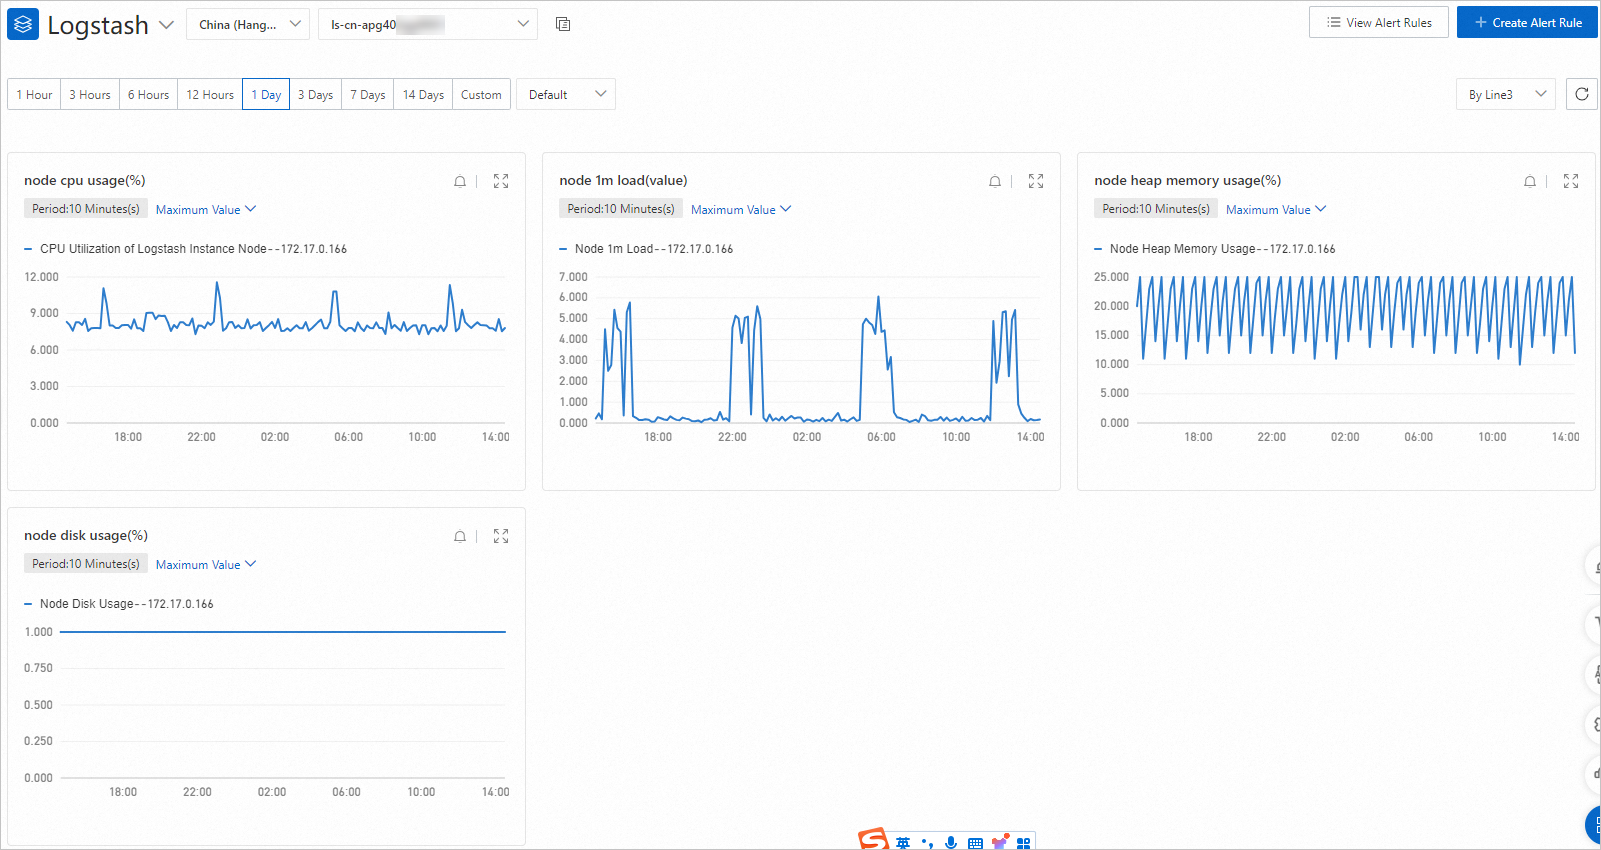
View the Logstash dashboard.
After the configuration is complete and the Logstash cluster enters a normal state, the system starts to monitor the cluster and displays monitoring data. If the value of a metric exceeds the related threshold, the system sends an alert notification to the specified alert contact. You can perform the following steps to view the Logstash dashboard:
In the left-side navigation pane of the CloudMonitor console, choose .
In the upper-right corner of the page that appears, select Logstash from the drop-down list and select the region where the Logstash cluster resides.
Select the Logstash cluster from the instance drop-down list and specify a time range to view the monitoring data of the cluster.