Many issues can cause a failure to ping an Elastic Compute Service (ECS) instance. This topic describes how to troubleshoot the issue.
Problem description
A local client cannot ping the public IP address of a destination ECS instance. For example:
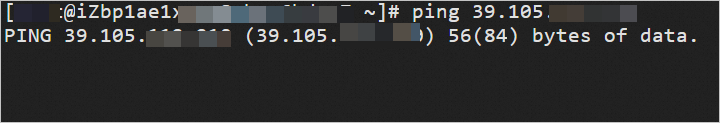
On a Linux local client, pinging the public IP address of the destination ECS instance returns no response, as shown in the following figure:
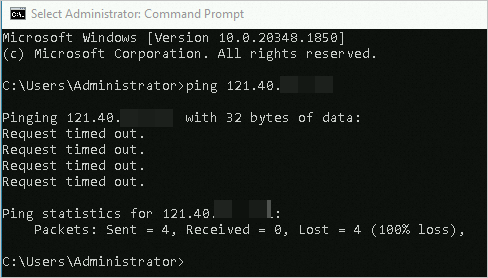
On a Windows local client, pinging the public IP address of the destination ECS instance returns a Request timed out error, as shown in the following figure:
Use the self-service troubleshooting tool
The Alibaba Cloud self-service troubleshooting tool helps you quickly check security group configurations, the instance's internal firewall, and the listening status of common application ports. The tool provides a clear diagnostic report.
Click to go to self-service troubleshooting page, and switch to the target region.
If the self-service troubleshooting tool cannot identify the issue, proceed with the following steps for manual troubleshooting.
Manual troubleshooting
If your local network is working correctly and you can access other websites, the failure to ping the public IP address of the destination ECS instance may be caused by the following issues. Check each possible cause as needed.
Possible causes | Solutions |
The ECS instance is not in the Running state | |
The network interface card of the ECS instance is not working correctly | Check the status of the network interface card of the ECS instance |
Incorrect routing configuration after the IPv4 gateway centralized control mode is enabled for the VPC | Check the IPv4 gateway configured for the VPC where the instance resides |
The network access control list (ACL) of the vSwitch does not allow ICMP traffic | Check the network ACL of the vSwitch where the ECS instance resides |
The security group does not allow ICMP traffic | Check the security group rules associated with the ECS instance |
The firewall of the ECS instance drops inbound ICMP requests | |
Resource bottlenecks on the ECS instance are causing network communication issues | Check the resource usage of the ECS instance, such as CPU or bandwidth |
Cross-border network fluctuations from carriers are causing Internet access issues | Check whether your instance is in the China (Hong Kong) region or a region outside China |
The domain name has no ICP filing or has a domain name resolution issue | Check the ICP filing or domain name resolution configuration |
An issue exists with the client or an intermediate node on the communication link | Perform a bidirectional link diagnosis from the client to the ECS instance |
The ECS instance is in a blackhole state | |
The ECS instance has been maliciously compromised |
Check the instance status
An ECS instance can provide services only when it is in the Running state. Perform the following steps to check the instance status:
Go to ECS console - Instances.
In the top navigation bar, select the region and resource group of the resource that you want to manage.

Find the destination ECS instance, click the instance ID to go to the instance details page, and check the instance status.
If the destination instance is not in the Running state, select a solution based on the instance status. For more information, see Start an instance.
Check the status of the network interface card of the ECS instance
A properly functioning elastic network interface (ENI) is essential for an instance to communicate normally, including being pinged and remotely connected. You can connect to the instance using a VNC connection and then check the ENI status as follows.
Check whether the ENI is enabled.
For a Linux instance: Run the
ip acommand. The connection information for the primary ENI eth0 should be visible, and its state should bestate UP.
If the primary ENI eth0 is not in the UP state, run the
sudo ifup eth0orsudo ip link set eth0 upcommand to re-enable the ENI.If you configured a secondary ENI for the instance, some operating system images may not automatically recognize it. You must configure it within the instance to enable communication. For example, if you associate an EIP with a secondary ENI that has not been configured, Internet communication will fail. For more information, see Step 2: Configure the Linux OS to recognize the ENI.
For a Windows instance: A malfunctioning ENI driver can cause the ENI to malfunction, leading to communication failures.
NoteThis operation uses Windows Server 2016 as an example. The UI may differ on other versions. Adjust the steps accordingly for your operating system version.
In the notification area, right-click the
 icon and select Open Network and Sharing Center.
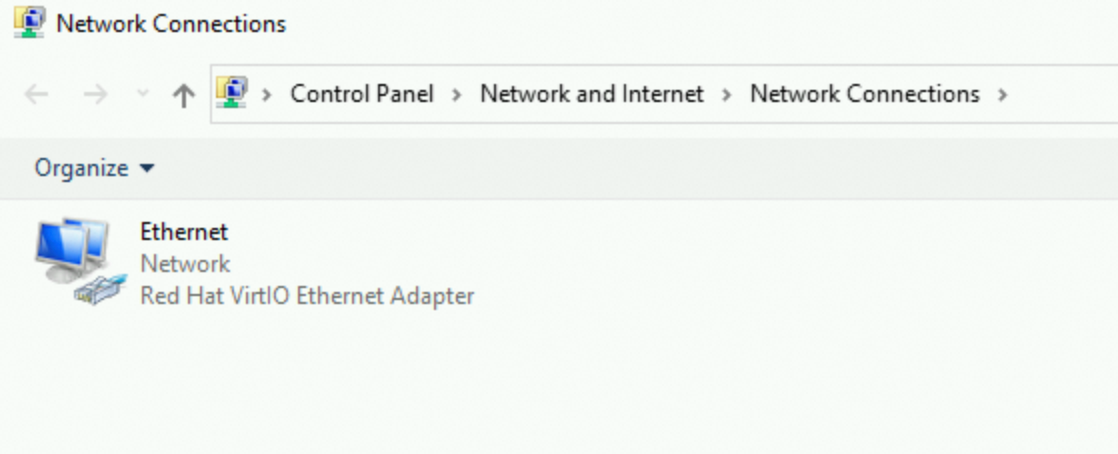
Click Change Adapter Settings to check whether the NIC is enabled.
If the network interface card is disabled, right-click it and select Enable. Verify that the remote connection to the Windows instance is restored.
If the NIC is enabled but still unavailable, proceed to the next step.
Open the Run window, enter
regedit, and click OK.In Registry Editor, navigate to and verify that the following entries exist in the right pane. If the entries do not exist, right-click a blank area and select New to add them.
ImportantAfter you change the information in the Registry Editor, you must restart the system for the changes to take effect.
Name:
Installer32Type:
REG_SZData:
NetCfgx.dll,NetClassInstaller
Open the Run window, enter
devmgmt.msc, and click OK.In Device Manager, under Network Adapters, right-click the network adapter and select Update Driver Software....
In the dialog box that appears, click Search Automatically For Updated Driver Software. When the update is complete, click Close.
Try to
pingthe public IP address of the ECS instance again.
Confirm that the IP address, subnet mask, and gateway are correctly configured (they must match the assigned values).
An ECS instance uses IP mapping between a public IP address and a private IP address to communicate with the Internet. If the private IP address is configured incorrectly, Internet communication will fail. The private IP address of the instance must be a valid assigned IP address.
For a Linux instance: Run the
ip acommand. The primary private IPv4 address corresponding to the ENI should be visible.
Keep the default DHCP automatic IP address assignment for the instance. When the network changes (such as switching VPCs or changing IP addresses), the internal configuration is updated automatically. For more information, see How to configure DHCP for a network in a Linux image.
If you manually apply a static configuration to the IP address inside the instance, ensure that the information is consistent with what is assigned. Otherwise, abnormal network communication will occur. For more information, see Resolve IP address inconsistency between the ENI configuration file and the console for a Linux instance.
By default, the ENI only recognizes the primary private IP address. If you assigned a secondary private IP address to the instance, you must configure it inside the instance for it to be enabled. If you associate an EIP with an unconfigured secondary private IP address, communication will fail. For more information, see Configure an operating system to recognize a secondary private IP address.
For a Windows instance, view and confirm the internal network connection information of the instance.
Open Network and Sharing Center.
Click Change adapter settings.
Double-click the primary ENI named Ethernet. Then, click Properties in the Ethernet Status dialog box.
In the Ethernet Properties dialog box, double-click Internet Protocol Version 4 (TCP/IPv4).
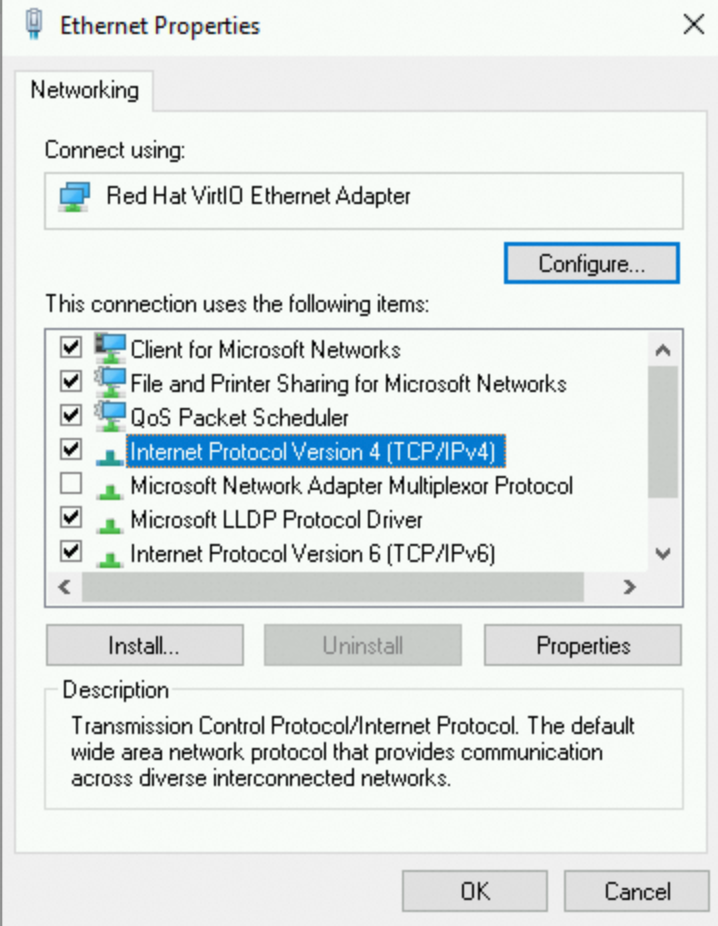
In the Internet Protocol Version 4 (TCP/IPv4) Properties dialog box, select Obtain an IP address automatically.
If you select Use the following IP address, make sure the information matches the values assigned in the console.

Check the IPv4 gateway configured for the VPC where the instance resides
By default, resources in a VPC can communicate directly with the Internet by being associated with a public IP address. If you enable an IPv4 gateway, all Internet traffic to and from the VPC is managed by the IPv4 gateway, and changes to the network policy will affect all instances in the VPC.
For example, if you delete the default route entry after you activate an IPv4 gateway, or if you select private mode when you delete the IPv4 gateway, Internet access for all resources in the VPC, including ECS instances, may be disrupted. You can confirm and fix this issue as follows:
Check whether the VPC where the instance resides is in the centralized control mode of the IPv4 gateway.
Go to ECS console - Instances.
In the top navigation bar, select the region and resource group of the resource that you want to manage.
On the Instances page, find the destination instance and click the instance ID to go to the Instance Details page.
In the Configuration Information section, click the VPC instance ID to go to the VPC console.
On the Basic Information page, if the current VPC shows the IPv4 Internet Access Mode as Centralized Control, it means that Internet access for all resources in this VPC, including your ECS instance, is managed by this gateway policy.

If your VPC is not under the centralized control of an IPv4 gateway, you do not need to perform this check.
If you want to keep this centralized IPv4 gateway management policy, you need to check whether the gateway routing configuration is correct.
When an IPv4 gateway is activated, the system adds a default route with a destination CIDR block of
0.0.0.0/0that points to the IPv4 gateway in the route table of your selected vSwitch. This enables Internet access for the vSwitch associated with the route table.If the current route table already has a default route with a destination CIDR block of
0.0.0.0/0, you cannot add another default route for the IPv4 gateway. If you manually delete this default route entry, Internet communication for the vSwitch will be disrupted.You can confirm and ensure the route entry is correctly configured as follows:
Go to ECS console - Instances.
In the top navigation bar, select the region and resource group of the resource that you want to manage.
On the Instances page, find the destination instance and click the instance ID to go to the Instance Details page.
In the Configuration Information section, click the vSwitch ID to go to the VPC console.
Click Route. You should see a custom route entry that was automatically added by the system when the IPv4 gateway was activated.

If you deleted it previously, click the route table ID and on the route table page, add the route entry shown in the figure above.

Add the route entry as follows:

If you have configured other custom route entries, make sure the routing links are correct.
If you no longer need centralized management by the IPv4 gateway, we recommend that you delete the IPv4 gateway in public mode.
Log on to the IPv4 Gateway console. In the top menu bar, select the region where the ECS instance is located.
Find the IPv4 gateway associated with the VPC where the ECS instance resides.
If the IPv4 gateway exists: Find the destination IPv4 gateway and delete it in Public Mode.
ImportantIf you delete the gateway in private mode, all resources within the VPC will be unable to communicate with the Internet. Proceed with caution.

After deletion, the VPC page will show that the IPv4 Internet Access Mode is Direct Internet Access, and the Internet communication of the ECS instance will no longer be managed by the IPv4 gateway.

If the IPv4 gateway does not exist: If you cannot find the IPv4 gateway associated with the VPC, you may have already deleted it in private mode.
Solution 1: Re-create an IPv4 gateway for the VPC where the ECS instance resides, and then delete it in public mode. For more information, see Create an IPv4 gateway.
Solution 2: If the instance configuration is simple (such as not involving secondary ENIs or secondary private IP addresses), you can try changing the VPC of the instance to one that does not have an IPv4 gateway enabled. For more information, see Change the VPC of an ECS instance.
For more information about IPv4 gateways, see IPv4 Gateway.
Check the network ACL of the vSwitch where the ECS instance resides
A network ACL is a network access control feature in a virtual private cloud (VPC). If you associate a network ACL with the vSwitch where the ECS instance resides, inbound and outbound network traffic for the instance is restricted by the network ACL rules. You can check this as follows:
Log on to the VPC console.
In the navigation pane on the left, choose .
In the upper-left corner of the page, select the region where the ECS instance is located.
In the network ACL list, check whether a network ACL exists for the VPC where the ECS instance resides.
If it does not exist or is not associated with the vSwitch of the ECS instance: You do not need to perform this check.
If it exists and is associated with the vSwitch of the ECS instance: You need to ensure that the network ACL rules for the VPC do not contain a deny policy for the IP address of your test client. Make sure that an allow policy is added for your desired source address, protocol type (ICMP must be allowed for ping), and port range.
By default, when a vSwitch is associated with a network ACL, rules are automatically added to allow all traffic in both inbound and outbound directions, as shown in the following figures. If you delete these rules, access will be restricted.
The inbound rule is shown in the following figure:

The outbound rule is shown in the following figure:

Configure the source/destination address and protocol type (ICMP must be allowed for ping) based on your business needs, following the principle of least privilege. Avoid opening all ports (use ::/0 or 0.0.0.0/0 with caution) to prevent security issues. For more information, see Create and manage a network ACL.
Check the security group rules of the ECS instance
The security group of the ECS instance must contain a rule that allows the ICMP protocol, which enables pinging the instance. If this rule is deleted, you cannot ping the instance. You can troubleshoot this as follows:
In the top navigation bar, select the region and resource group of the resource that you want to manage.
Find the destination security group associated with the ECS instance. In the Operation column, click Manage Rules.
In the security group access rules, check whether an ICMP protocol rule exists for the inbound direction.

If no inbound ICMP protocol rule exists, add one. For more information, see Add a security group rule.
Set Action to Allow, keep the default Priority, set Protocol to All ICMP - IPv4, set Port to
-1/-1, and for Source, allow access only from specific IP addresses.Check the outbound rules based on the security group type.
Basic security group: For a basic security group, the outbound direction allows all access by default. This means that all access from ECS instances within the security group to external networks is permitted, and you do not need to configure any related rules.

Advanced security group: The outbound direction denies all access by default. This means that all access from ECS instances within the security group to external networks is prohibited. If the security group is an enterprise security group, you must ensure that a rule allowing ICMP traffic also exists for the outbound direction. For more information, see Basic security groups and enterprise security groups.

Check the firewall configuration of the ECS instance
If the firewall is enabled on the server and has rules that block external access, remote connection attempts may fail. Check the configuration based on the operating system of your ECS instance.
Check the kernel parameters and firewall configuration of the Linux system
Whether a Linux system allows ping requests is determined by both the icmp_echo_ignore_all kernel parameter and the firewall settings. If either one denies the request, you will not be able to ping the instance.
Check the kernel parameters of the Linux system
Connect to the ECS instance using a VNC connection.
For more information, see Connect to an instance using VNC.
Check the value of the
icmp_echo_ignore_allkernel parameter.cat /proc/sys/net/ipv4/icmp_echo_ignore_allIf the command returns 0, all ICMP requests are allowed. Proceed to Check the Linux firewall configuration.
If the command returns 1, all ICMP requests are denied. Proceed to step 3.
Change the value of the
icmp_echo_ignore_allkernel parameter to 0 to allow all ICMP requests.Temporarily allow
echo 0 >/proc/sys/net/ipv4/icmp_echo_ignore_allPermanently allow
echo net.ipv4.icmp_echo_ignore_all=0 >> /etc/sysctl.conf
sysctl -p
Check the Linux firewall configuration
Connect to the ECS instance using a VNC connection.
For more information, see Connect to an instance using VNC.
View the firewall rules.
iptables -LIf the following result is returned, the corresponding ICMP rule is not blocked.
Chain INPUT (policy ACCEPT)
target     prot opt source               destination
ACCEPT     icmp --  anywhere             anywhere             icmp echo-request
Chain OUTPUT (policy ACCEPT)
target     prot opt source               destination
ACCEPT     icmp --  anywhere             anywhere             icmp echo-reque
If the returned result shows that the corresponding ICMP rule is blocked, run the following command to enable the rule.
#Chain INPUT
iptables -A INPUT -p icmp --icmp-type echo-request -j ACCEPT
#Chain OUTPUT
iptables -A OUTPUT -p icmp --icmp-type echo-reply -j ACCEPT
Check the Windows firewall configuration
This procedure uses Windows Server 2012 as an example. The steps for other versions of Windows Server are similar.
Connect to the ECS instance using a VNC connection.
For more information, see Connect to an instance using VNC.
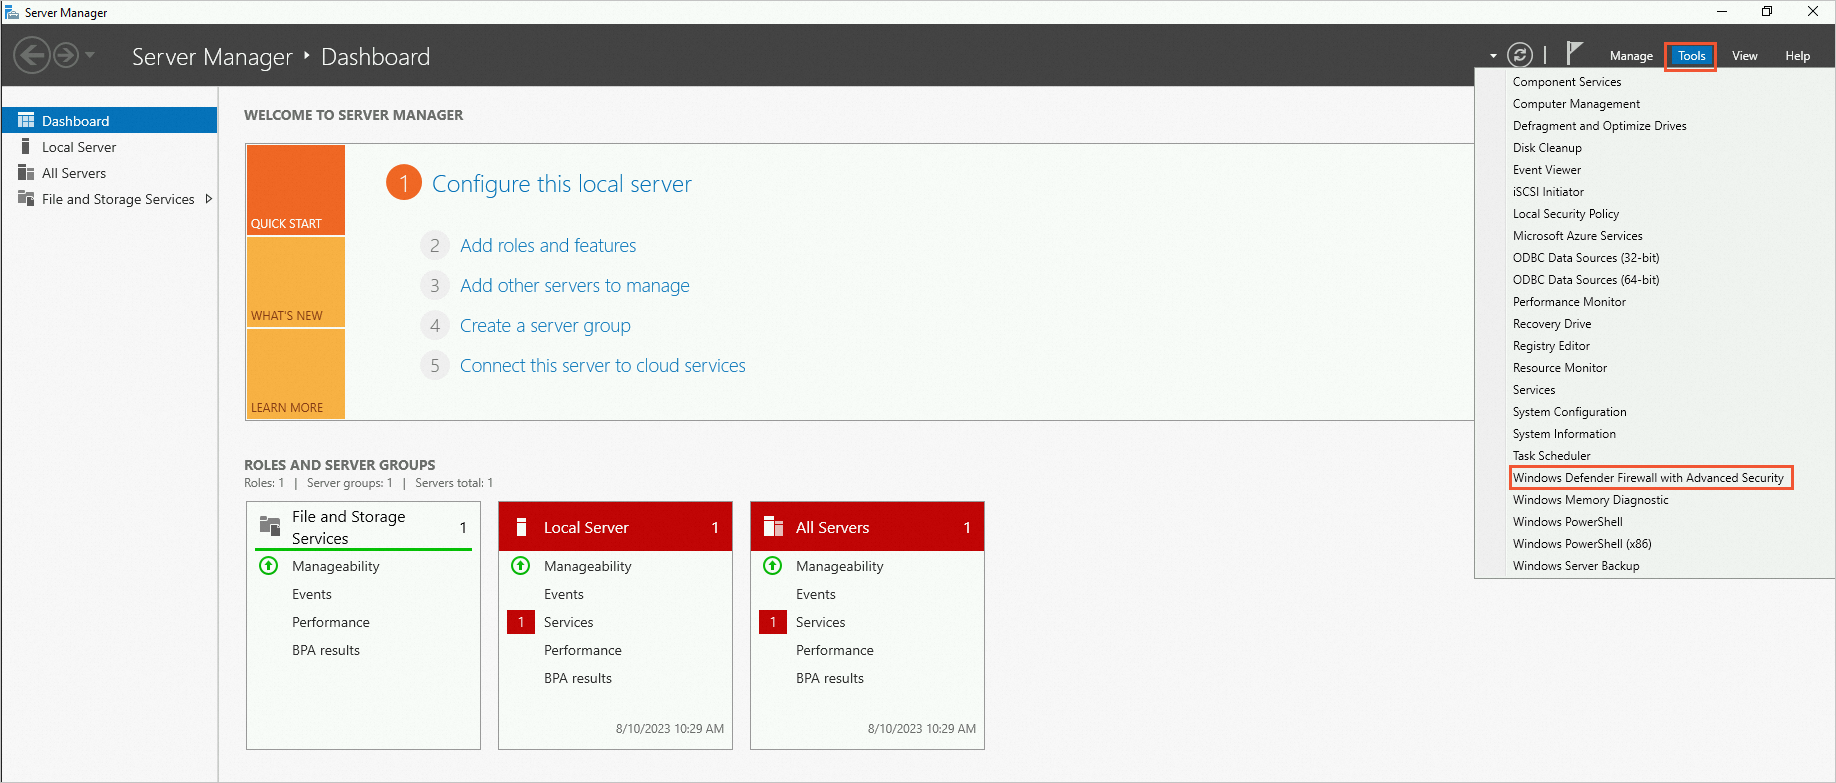
Click the
 icon in the lower-left corner to open Server Manager.
In the upper-right corner, choose Tools > Windows Defender Firewall with Advanced Security.
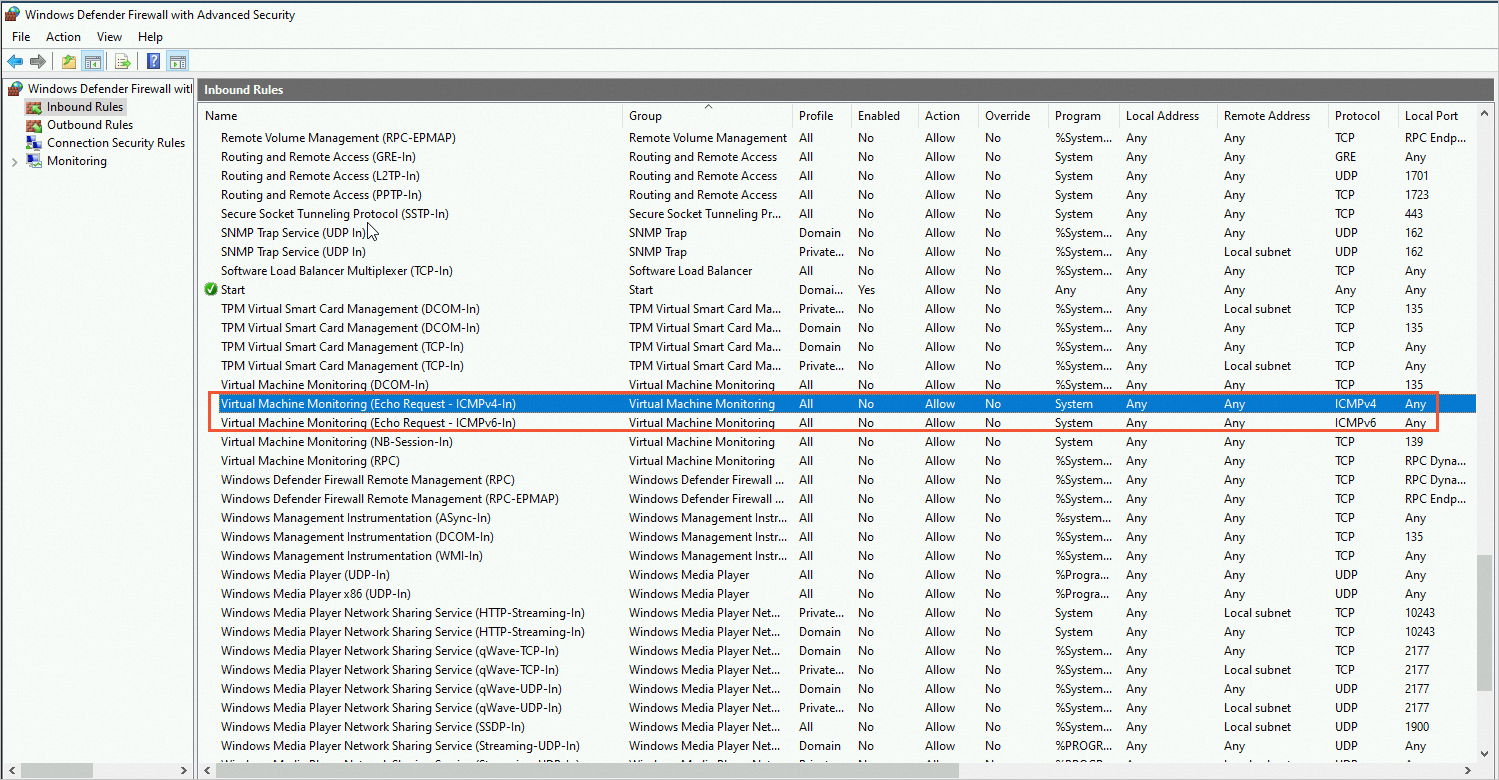
On the Windows Defender Firewall with Advanced Security page, check whether the ICMP-related protocols in the Inbound Rules and Outbound Rules are blocked.
If the ICMP-related protocols are blocked, as shown in the following figure, enable the rule.
Check the CPU or bandwidth usage of the ECS instance
Resource bottlenecks on an ECS instance, such as high CPU usage, full bandwidth, memory exhaustion, or excessive disk I/O, can directly or indirectly cause issues with public IP communication, such as ping failures.
When CPU or memory resources are exhausted, the system's protocol stack process may experience scheduling delays. This can cause ICMP responses to time out or be dropped by the kernel. Sustained bandwidth saturation directly blocks packet transmission and reception, preventing ping requests from completing. Extreme disk I/O load can cause the system to freeze (for example, processes blocked in D state), which indirectly slows down the response of network services. The risk of network unavailability is significantly higher in high-load scenarios. For example, a burst of traffic might overload both the CPU and bandwidth, or insufficient memory might cause frequent swapping and increase disk I/O pressure.
You can use Health Diagnostics or CloudMonitor to view instance metrics such as bandwidth, memory, and CPU. Use tools such as sar and atop on Linux or Resource Monitor on Windows to identify abnormal processes. To resolve the issue, you can free up resources or scale out your instance. For more information, see Troubleshoot and resolve high instance load issues.
Check for blackholes
Check whether you have received a blackhole notification. During blackhole filtering, you cannot remotely connect to or ping the ECS instance.
For more information, see Alibaba Cloud blackhole filtering policy.
Check for security alerts in Security Center
Check Security Center for any unusual security alert notifications. A malicious intrusion can also cause an ECS instance to become unpingable. For more information, see View security risks of an ECS instance.
Check whether your instance is in the China (Hong Kong) region or a region outside China
International egress bandwidth resources between carriers in different regions are limited. Cross-regional traffic must pass through multiple routing hops, which can lead to high latency, packet loss, and jitter due to line congestion, BGP route detours, or policy-based rate limiting. If you access an ECS instance in the China (Hong Kong) region or a region outside China from an instance in the Chinese mainland, the link quality may be affected by carrier lines. Try again later.
Follow the principle of proximity. Customers in the Chinese mainland should access servers deployed in regions within the Chinese mainland (such as North China or East China). Customers outside the Chinese mainland should access nearby nodes (such as China (Hong Kong) or Singapore) to ensure access stability and comply with data regulations in multiple locations.
If your business heavily relies on cross-border communication, you can use Global Accelerator (GA) to optimize routing or use Cloud Enterprise Network (CEN) to build a cross-border private connection for low-latency communication.
Perform a bidirectional link diagnosis from the client to the ECS instance
If only a specific client cannot ping the ECS instance but other clients can, run a bidirectional link test from both the client and the ECS instance to identify issues with intermediate network nodes or local configurations. For more information, see Use the MTR tool for network link analysis.
Check the ICP filing or domain name resolution configuration
If you can ping the public IP address but not the domain name, the issue may be caused by a lack of ICP filing or a domain name resolution error.
According to regulatory requirements, a domain name that resolves to a server in the Chinese mainland must have an ICP filing before it can be used for website access. Therefore, websites without an ICP filing number are not accessible. The Alibaba Cloud monitoring system will identify and block web services for such websites.
If the domain name does not have an ICP filing, you must obtain one. For more information, see What is an ICP filing?
If the domain name already has an ICP filing, check whether the domain name resolution is invalid. For more information, see Test whether a DNS record has taken effect.