The Edge Security Accelerator (ESA) page monitoring feature collects real user data from PC and mobile devices via automatic or manual JavaScript integration, tracks core web vitals in real time, supports HTML page analysis, and assigns green, yellow, or red performance grades.
Feature overview
ESA page monitoring tracks website performance using real user data from PC and mobile devices. The service captures the following core web vitals and performance metrics:
-
CLS (Cumulative Layout Shift): Measures visual stability by tracking unexpected layout shifts during page loading.
-
FCP (First Contentful Paint): Measures the time until the page first renders content, reflecting perceived load speed.
-
FID (First Input Delay): Measures the delay between a user's first interaction and the browser's response, reflecting page interactivity.
-
LCP (Largest Contentful Paint): Measures when the largest visible element (image or text block) finishes rendering, reflecting main content load speed.
-
TTFB (Time to First Byte): Measures the time from a user request to the first byte of the server response.
-
INP (Interaction to Next Paint): Measures overall page responsiveness to user interactions across the full page lifecycle.
Usage notes
-
Page monitoring currently supports pages with a
content-typeoftext/htmlonly. Non-text/htmlpages or pages without access traffic produce no monitoring data. -
ESA sends data collected outside the Chinese mainland to Singapore. Only network metrics are collected; ESA does not collect or store personal user data.
Procedure
-
In the ESA console, navigate to site management and click the desired website in the Website column.
-
In the left-side navigation pane, click .
-
In the Page Monitoring area, click Add Monitoring. Enter the subdomain prefix to monitor, such as
monitor.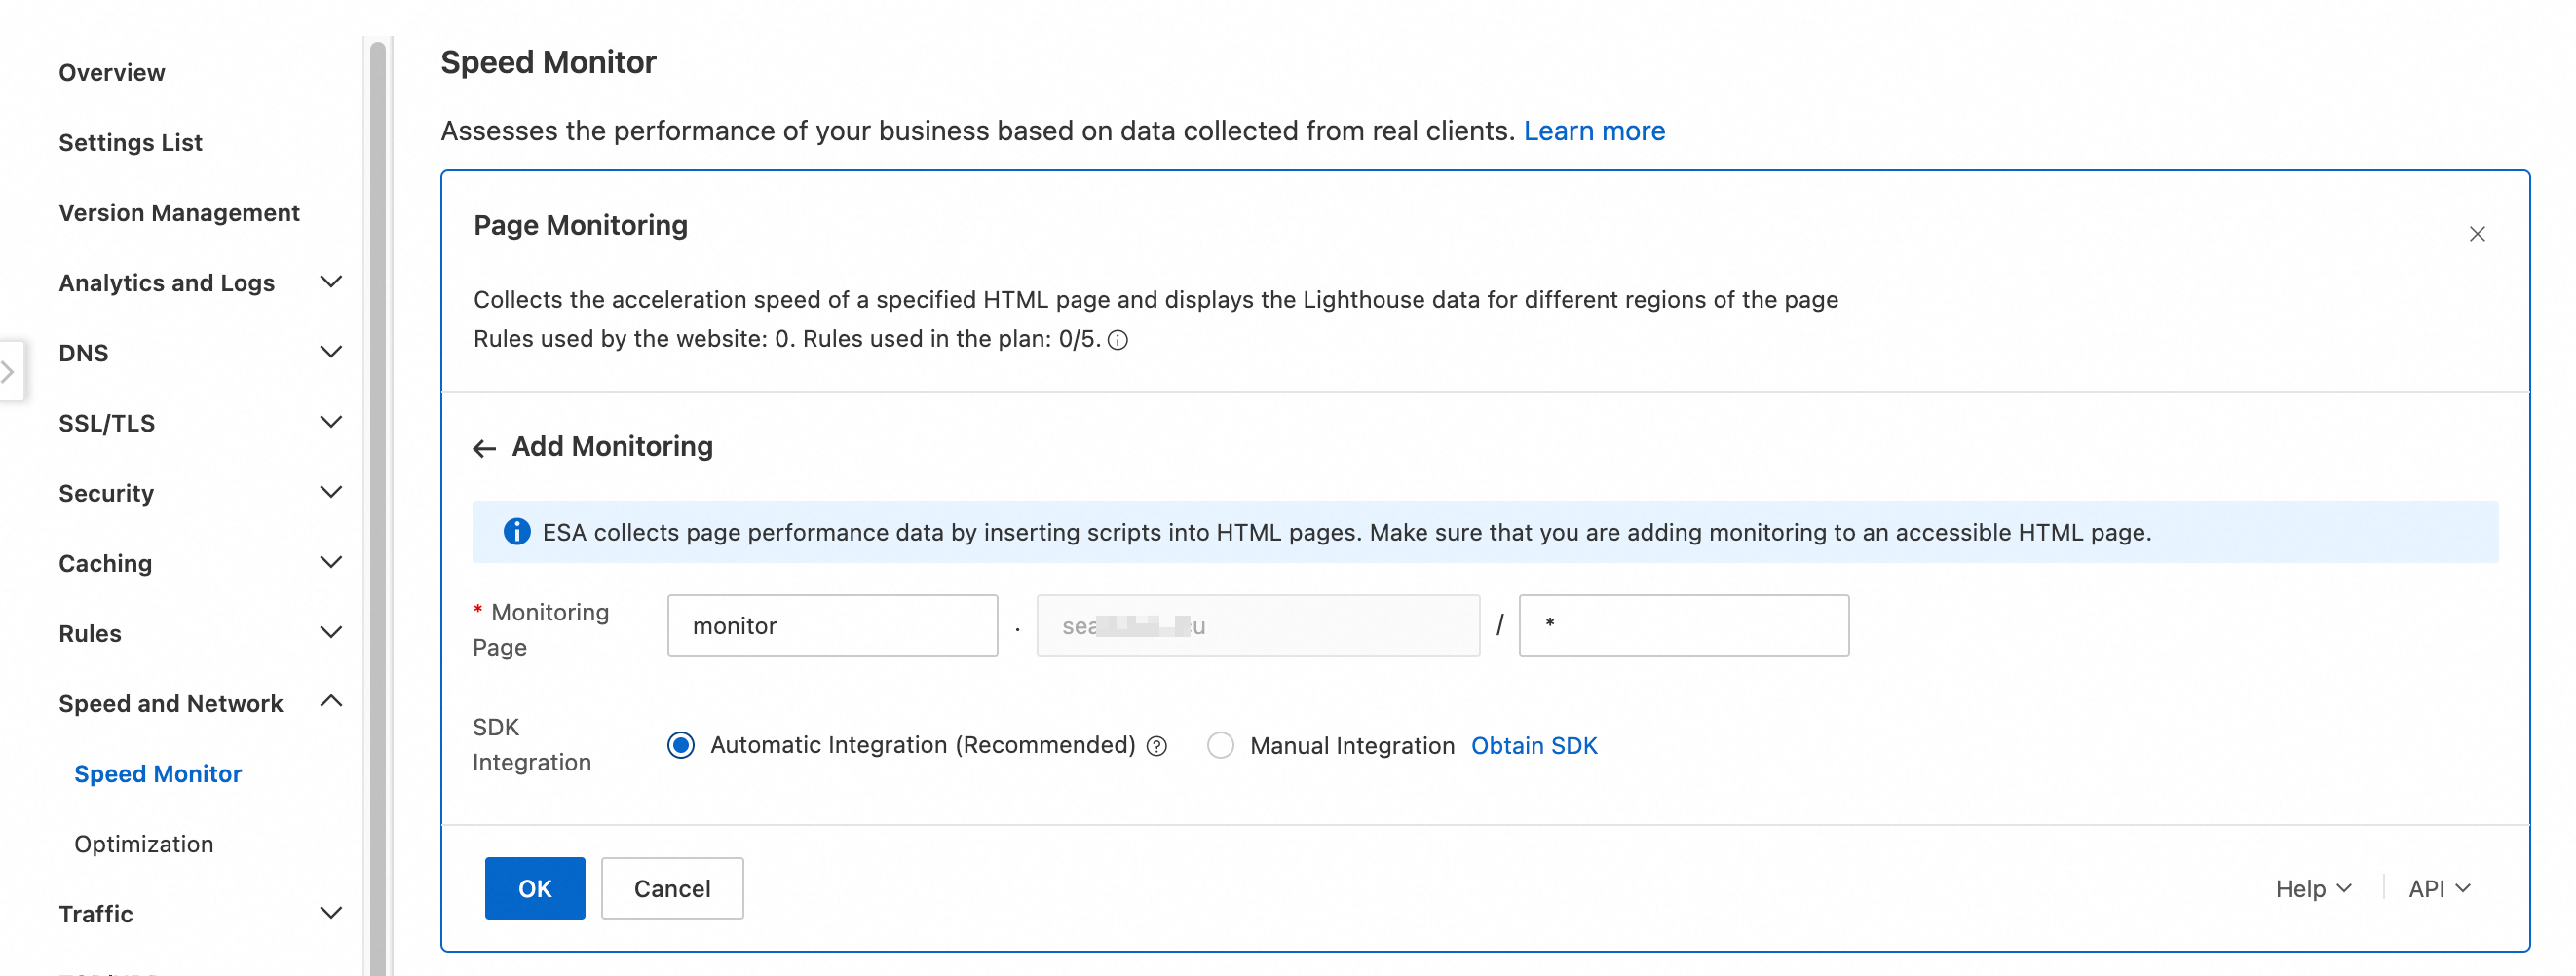
-
Select an SDK Integration. Page monitoring requires integrating a JavaScript collection script into your HTML pages. Two integration methods are available:
-
Automatic Integration (Recommended): ESA automatically injects the JavaScript into HTML responses from your origin without affecting page content.
-
Manual Integration: Manually add the following script tag to the HTML pages you want to monitor.
<script src="https://rjsperf.myalicdn.com/sdk.js"></script>
-
Performance grading
Each metric is graded as Good, Needs Improvement, or Poor based on the thresholds below. A "Good" rating indicates excellent performance, "Needs Improvement" is average, and "Poor" is subpar. Multiple factors affect these metrics, including client-side network conditions, ESA acceleration, and website rendering methods. To measure the acceleration from ESA, use Alibaba Cloud Application Real-time Monitoring Service (ARMS) or another synthetic monitoring tool.
|
Metric |
Good |
Needs Improvement |
Poor |
|
TTFB |
<0.8 s |
0.8-1.8 s |
>1.8 s |
|
FCP |
<1.8 s |
1.8-3 s |
>3 s |
|
LCP |
<2.5 s |
2.5-4 s |
>4 s |
|
CLS |
<0.1 |
0.1-0.25 |
>0.25 |
|
INP |
<200 ms |
200-500 ms |
>500 ms |
|
FID |
<130 ms |
130-250 ms |
>250 ms |
Feature availability by plan
|
Page monitoring |
Entrance |
Pro |
Premium |
Enterprise |
|
Number of monitored pages |
1 |
3 |
5 |
10 |