Functions and Pages provides performance and error monitoring metrics that help you understand service workload and identify exceptions.
View metrics
-
Log on to the ESA console. In the left-side navigation pane, choose . Click the target Functions and Pages service.
-
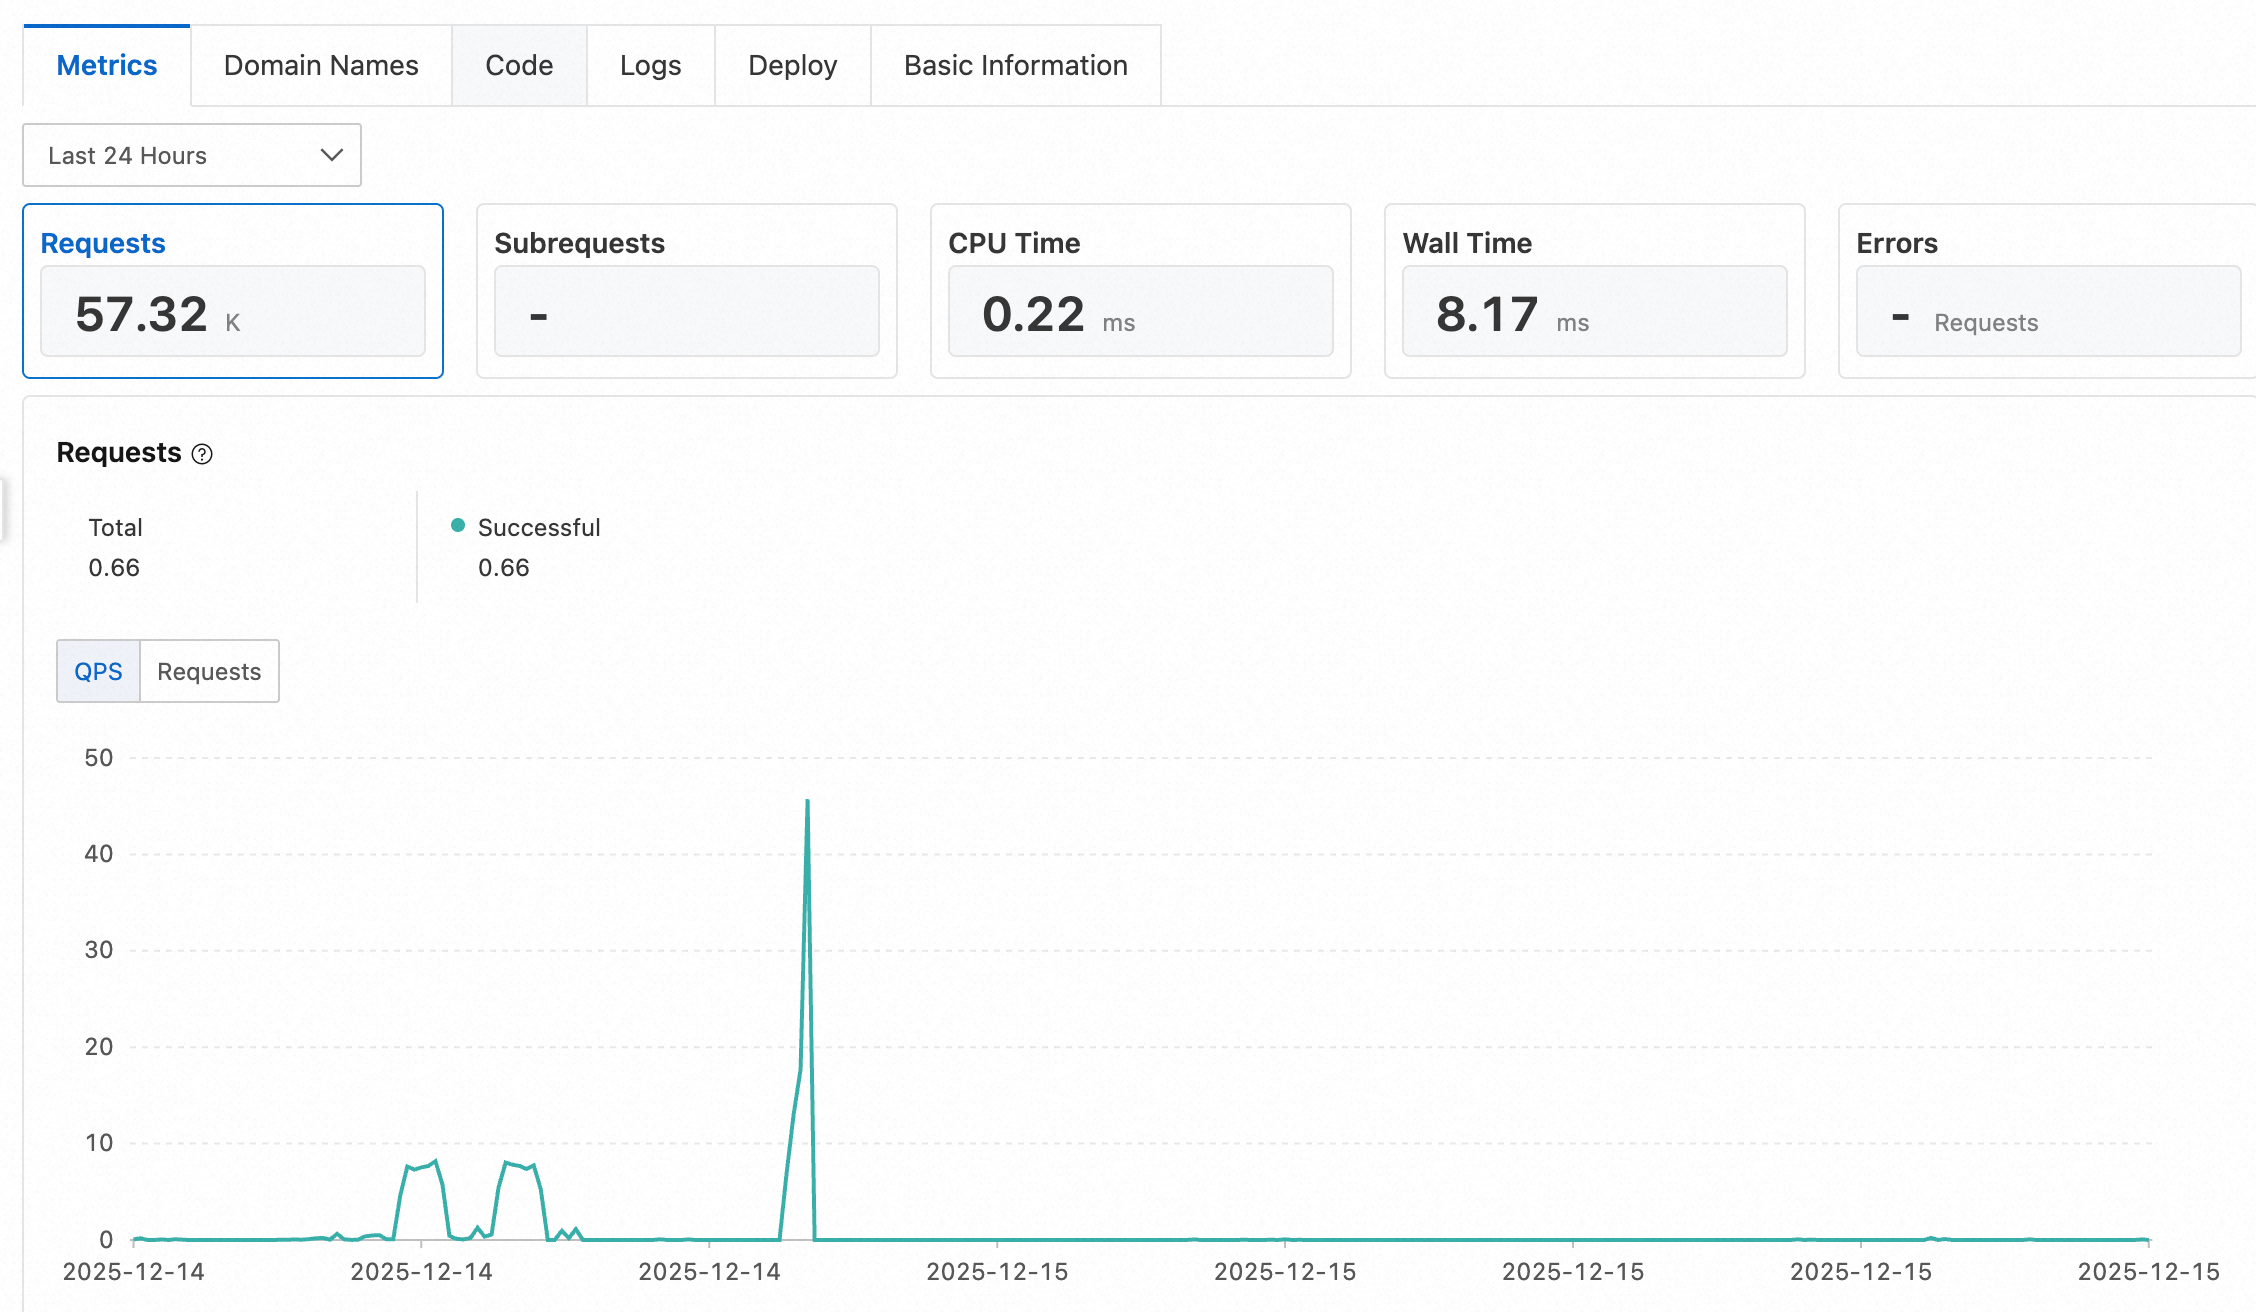
On the Metrics page, click a function metric, such as Requests, Subrequests, CPU Time, Wall Time, or Errors, to view its details.
Metrics
Requests
The Requests metric displays the historical request count for Functions and Pages, broken down by successful and failed requests.
-
Success: The function executed successfully without throwing an exception.
-
Failure: The function execution failed. Common causes include script exceptions, CPU limit exceeded, and internal errors.
You can view this data as queries per second (QPS) or as a total request count within a specific time frame, such as one minute.
Subrequests
A subrequest is a request triggered by an internal fetch API call within Functions and Pages. This metric displays the count of subrequest responses, categorized by status code: 2xx, 3xx, 4xx, and 5xx.
-
2xx: Indicates a successful response.
-
3xx: Indicates a redirection.
-
4xx: Indicates a client error.
-
5xx: Indicates a server error.
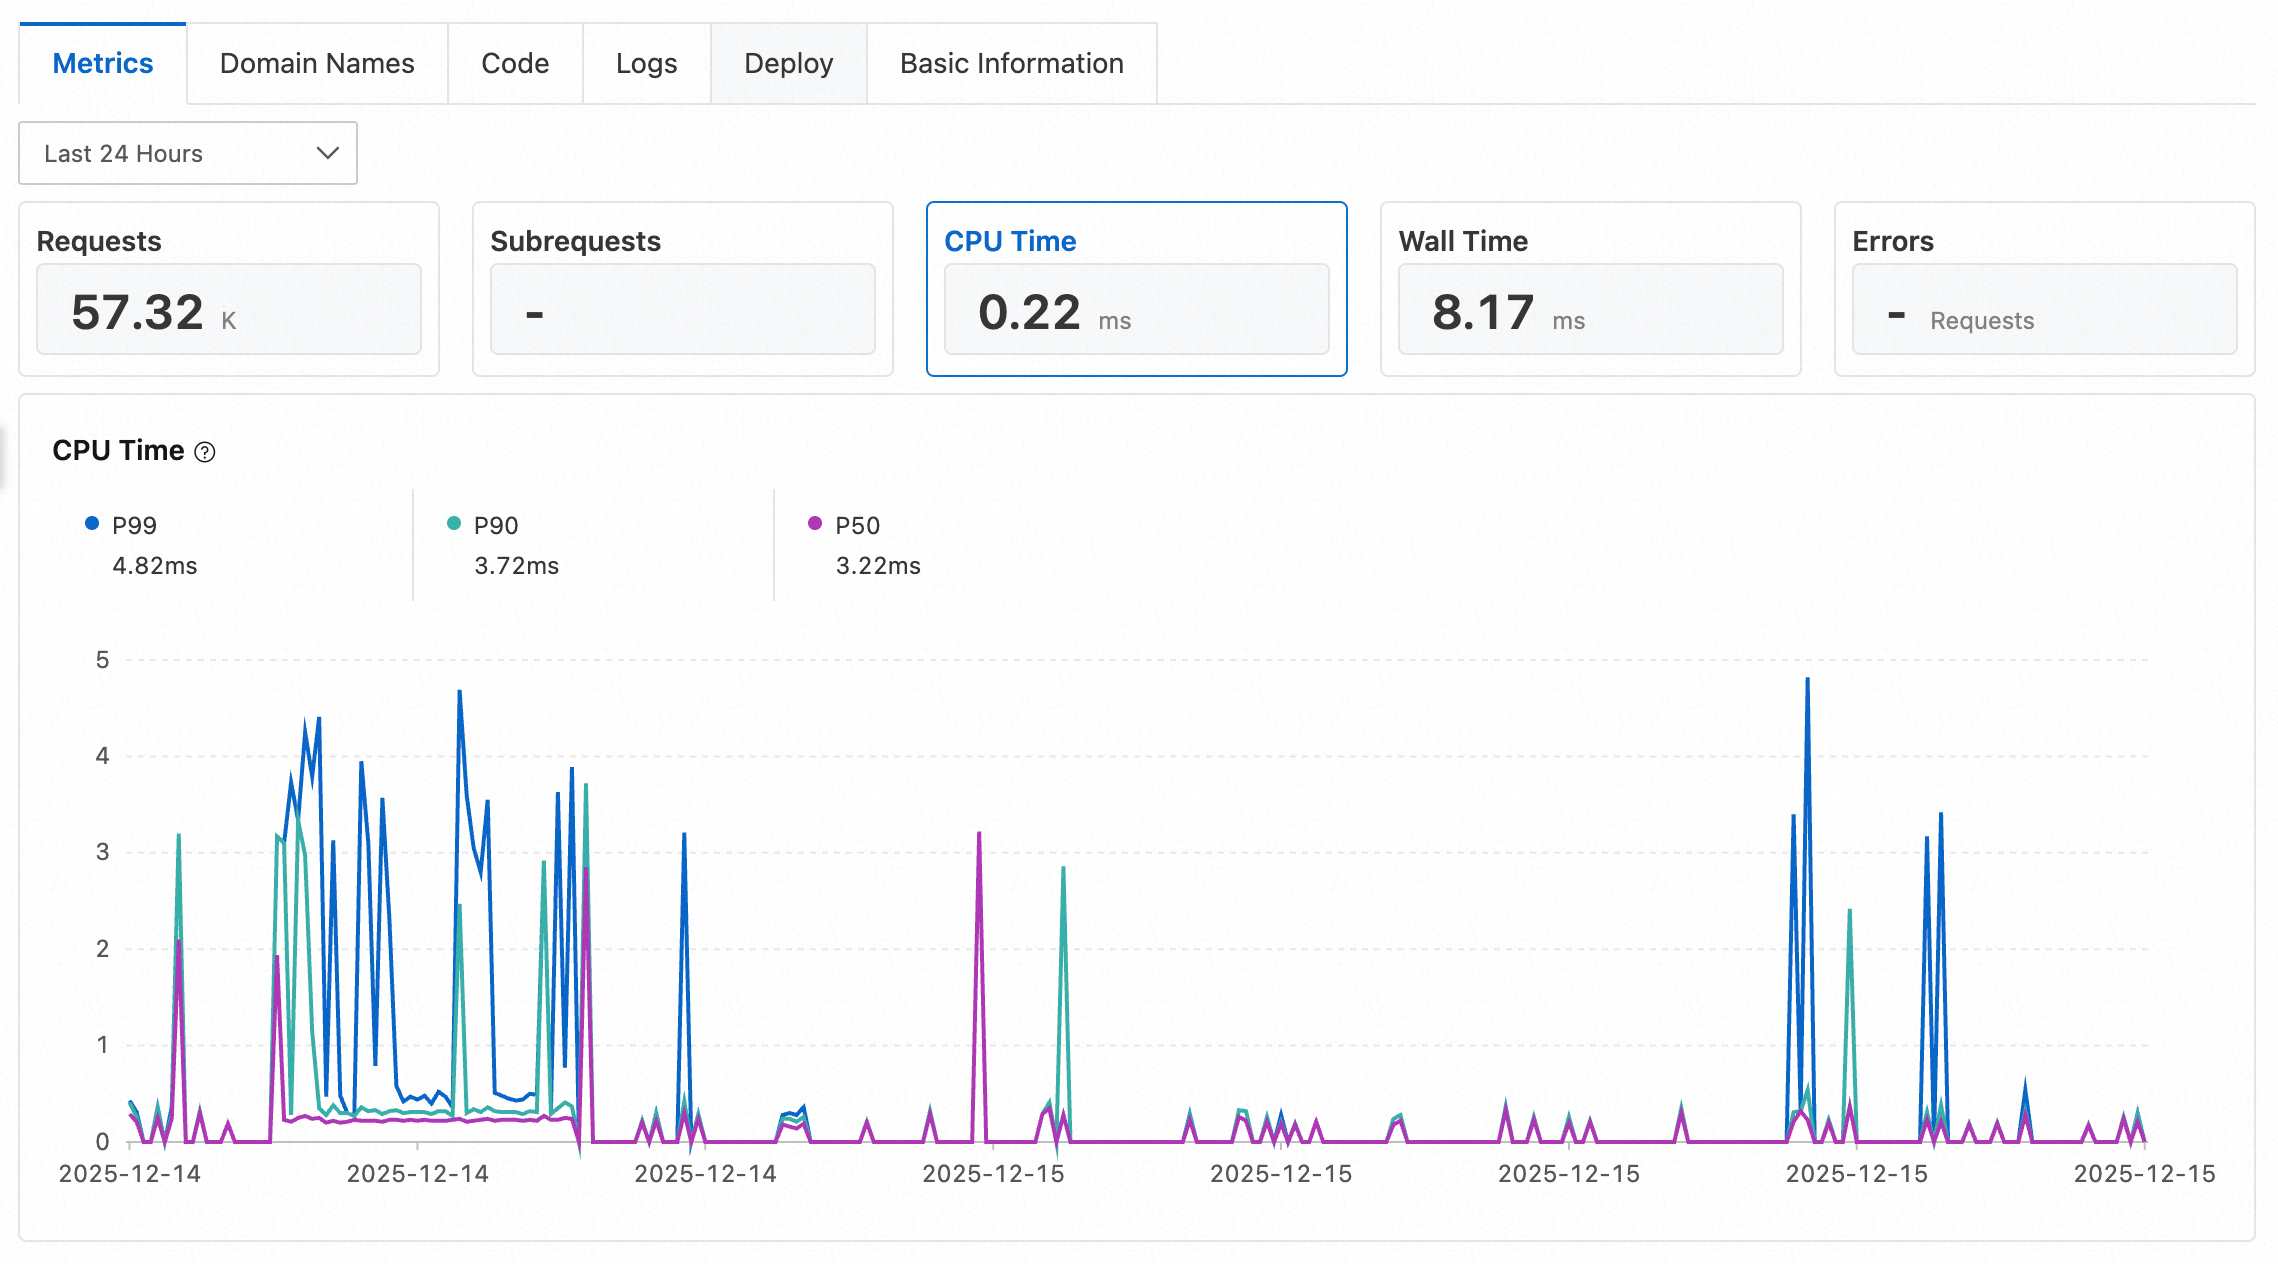
CPU Time
This metric measures the actual CPU time consumed by your Functions and Pages service during execution, excluding time spent waiting for I/O. CPU time is reported as percentiles to help you assess function performance.
-
P50: Represents the 50th percentile of CPU time. This means 50% of requests used this amount of CPU time or less.
-
P90: Represents the 90th percentile of CPU time. This means 90% of requests used this amount of CPU time or less.
-
P99: Represents the 99th percentile of CPU time. This means 99% of requests used this amount of CPU time or less.
Wall Time
This metric measures total request execution time, from when the function is triggered until it completes. Wall Time includes time spent waiting for I/O and executing waitUntil() tasks. For example, wall time continues to accumulate after a response is sent to the client until all waitUntil() callbacks finish. Wall Time is reported as P50, P90, and P99 percentiles.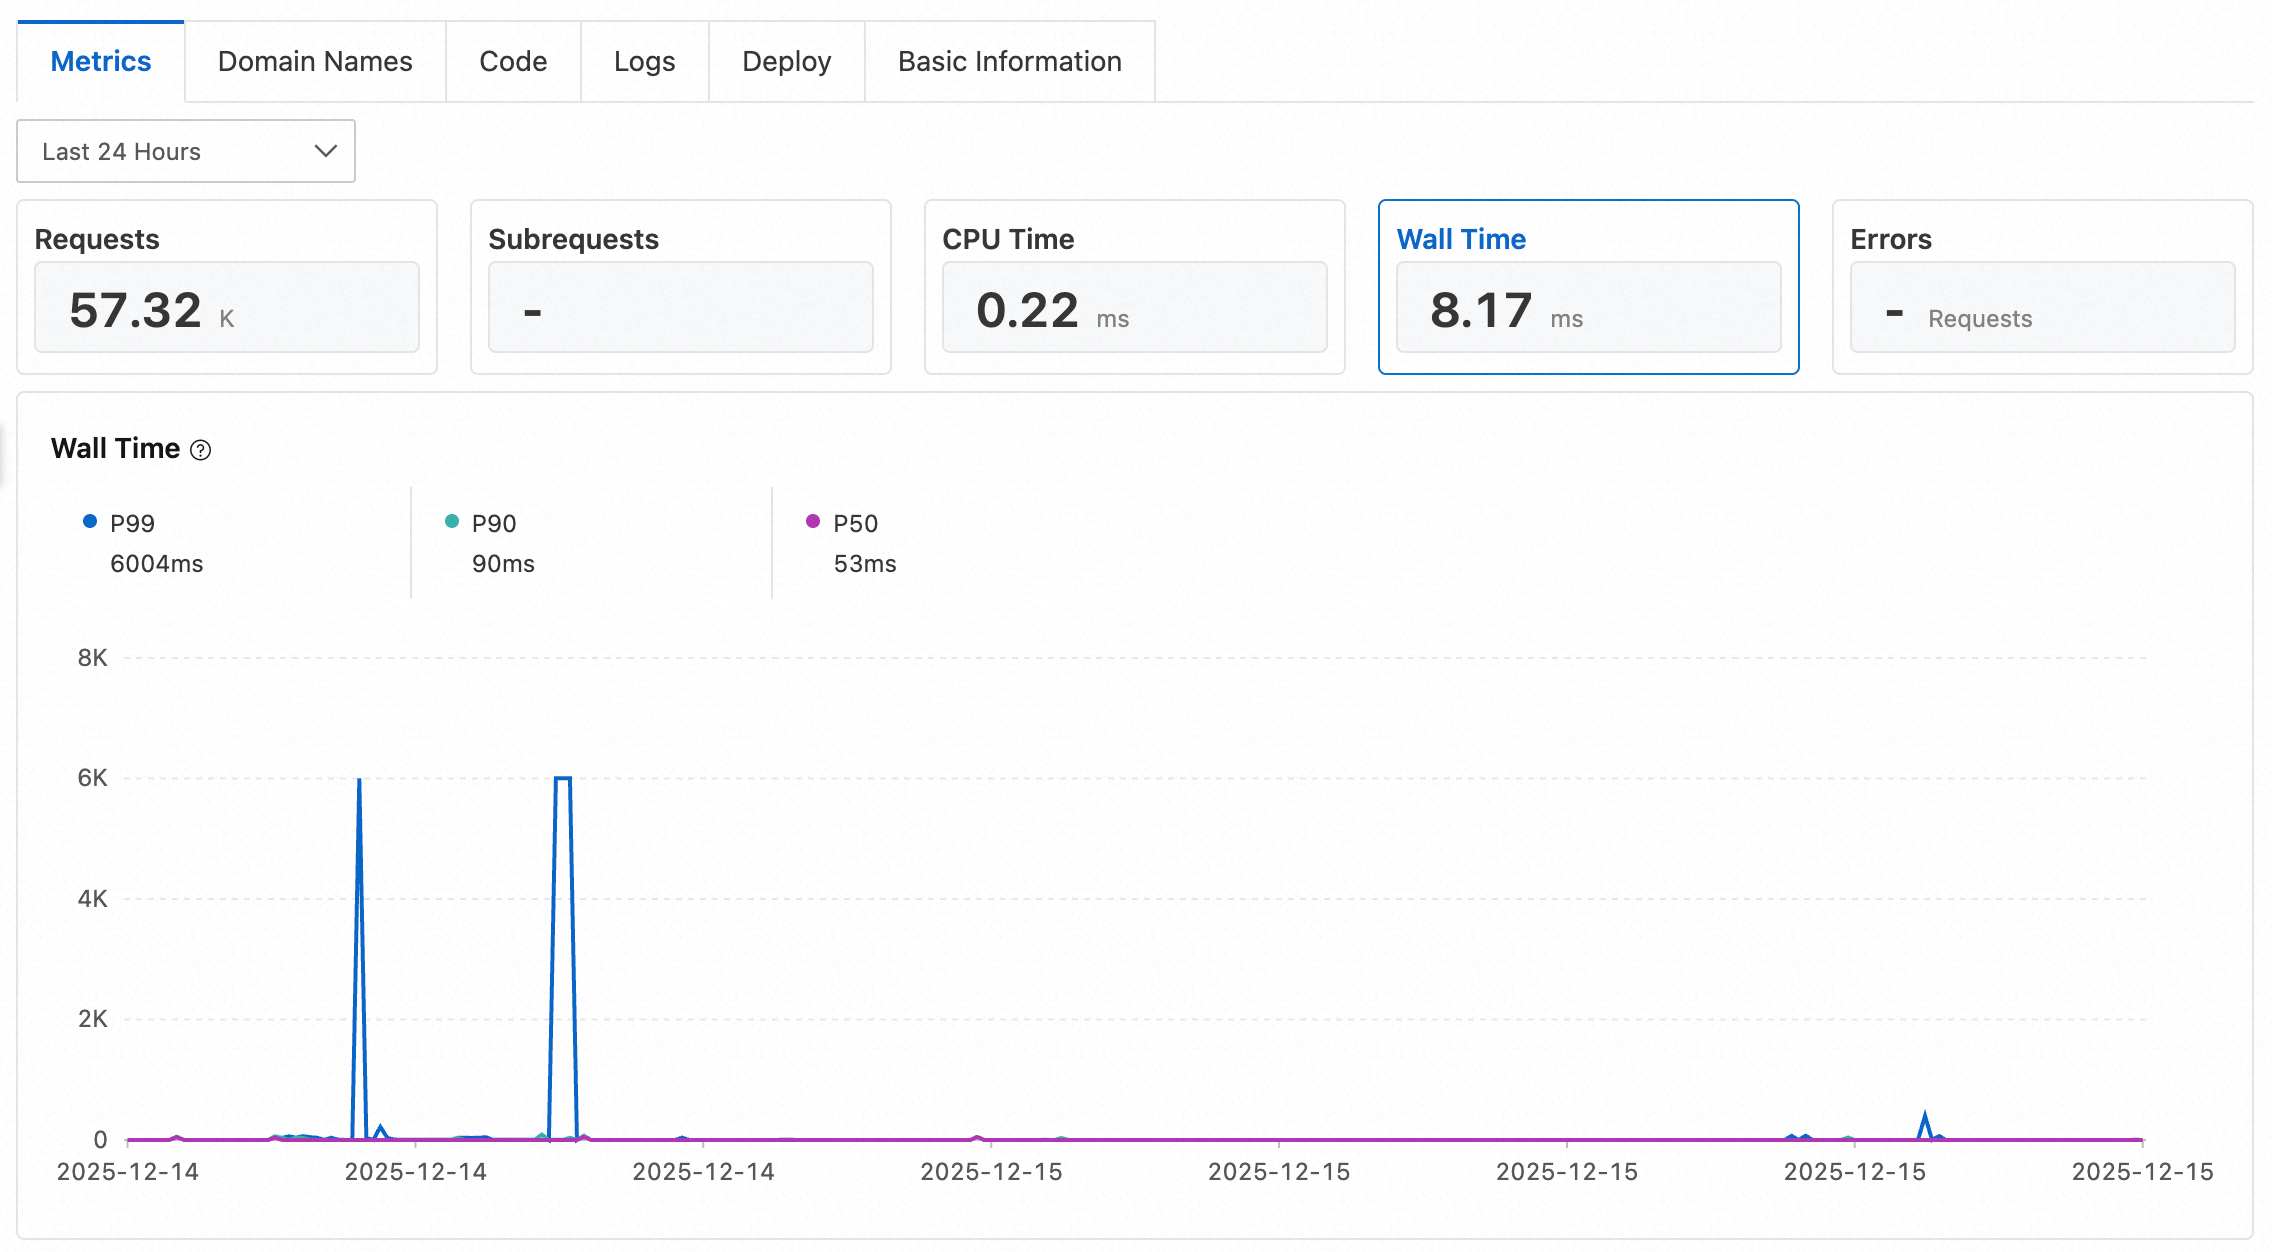
Errors
Functions and Pages tracks the error count for the following error types. To view detailed error messages, create a real-time log delivery task and inspect the error_message field in the logs.
|
Error type |
Description |
Log error code |
|
Script exception |
A JavaScript execution error occurred, including script compilation errors. |
1 |
|
CPU limit exceeded |
The actual CPU time consumed exceeded the function's configured limit. |
2 |
|
Memory limit exceeded |
The memory usage exceeded the function's limit (128 MB). |
3 |
|
Request execution time exceeded |
The request execution time exceeded the maximum limit (120 s). |
4 |
|
Client disconnected |
The client terminated the connection. |
5 |
|
Internal error |
An internal platform error occurred. To investigate the cause, submit a ticket. |
6 |