ESA analyzes access logs and back-to-origin logs to provide traffic analytics and visualizations for your website, helping you monitor performance and make data-driven decisions.
Benefits
Traffic analytics uses access logs from ESA nodes. Each ESA log records the client IP, request time, type, and response status. ESA aggregates these logs into accurate traffic statistics and reports.
Traffic analytics covers the following dimensions:
-
Geographical distribution: Breaks down traffic by country and region to help you optimize localized services and target markets.
-
Performance and efficiency: Evaluates content delivery and website health through page views and error code counts to help you identify issues.
-
Resource optimization: Plan bandwidth, optimize caching, and reduce back-to-origin load based on total traffic and request data.
-
Security and compliance: Monitor your security posture and data transmission through metrics such as encrypted request counts.
View and download reports
-
In the ESA console, select Websites, and in the Website column, click the target site.
-
In the left navigation pane, choose .
-
On the Traffic Analytics page, view traffic statistics and analysis. Click the
 icon to print the report, or the
  icon to download data in CSV format. You can also apply filter conditions to narrow results.
Metrics
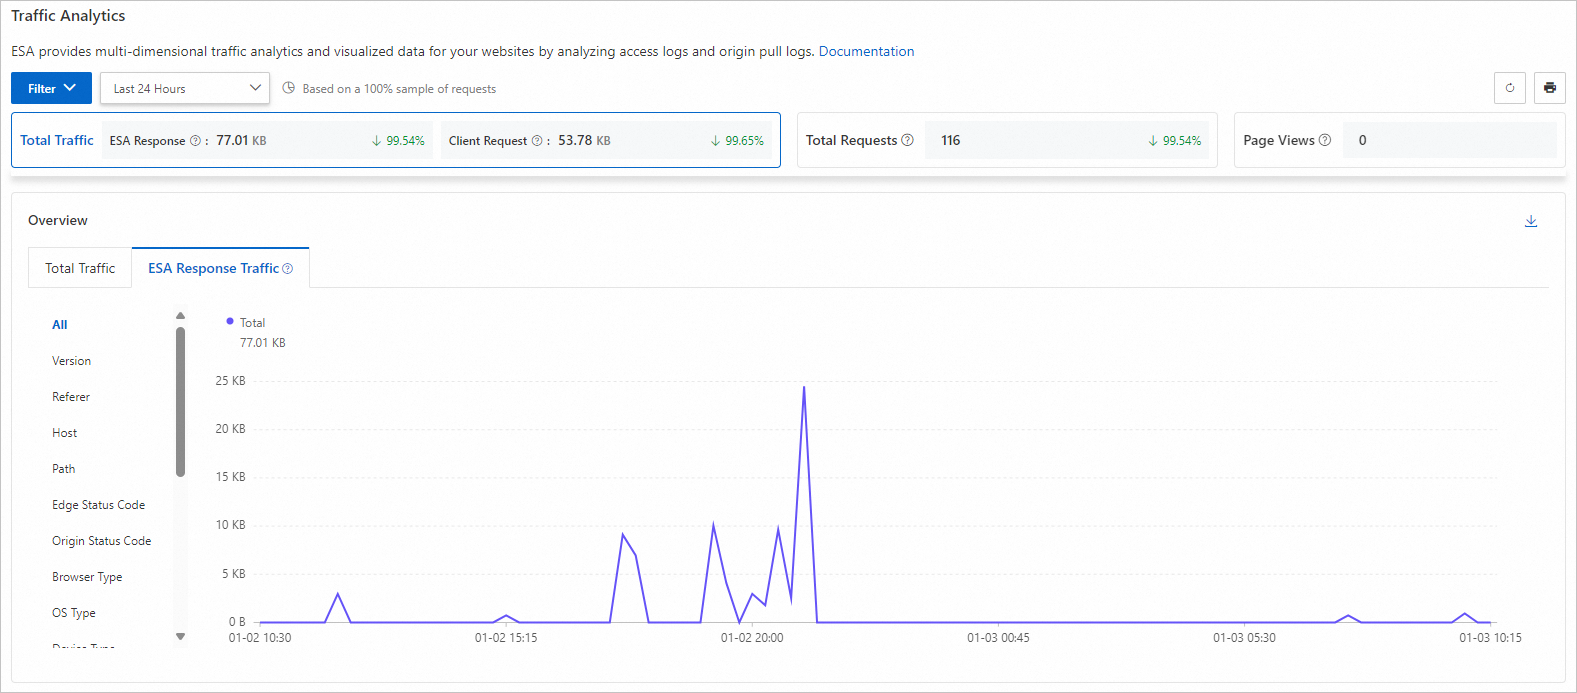
Overview
The Overview module shows total traffic and ESA response traffic in a line chart for historical trend analysis.
-
Total Traffic: All traffic delivered to clients through ESA.
-
Total Requests: The total number of requests that ESA receives from clients.
-
Page Views: The number of successful HTTP responses with a content type of HTML.
-
Metric change percentage: The period-over-period percentage change for each metric, comparing the selected time range with the immediately preceding equivalent period. If no prior data exists, the change rate is not displayed.
For example, if you select the Last 30 Days time range, a 2.03% increase in requests means ESA received 2.03% more requests in the last 30 days compared to the preceding 30-day period.
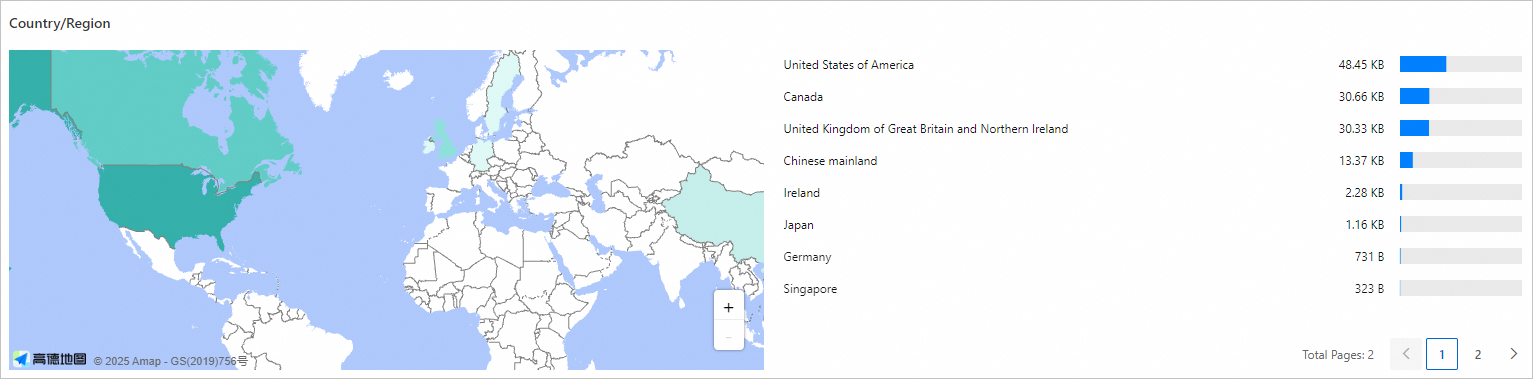
Country/region
Shows the geographical distribution of your traffic to help you target markets and refine strategies.
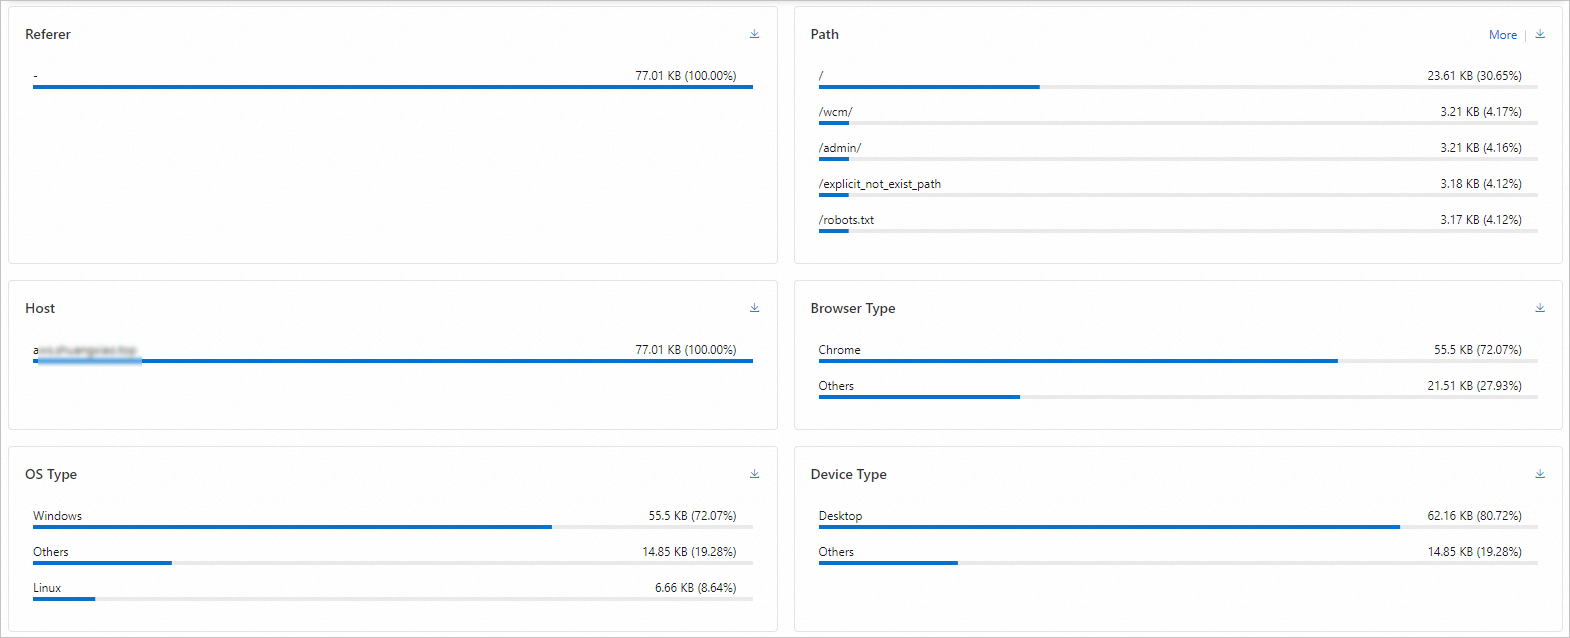
Top data by dimension
These modules analyze traffic and user behavior across multiple dimensions. Select a time range to view detailed data and visualizations.
By default, the top 5 entries are shown. Click More to expand the list.
Estimating back-to-origin traffic
The traffic analytics page does not directly report back-to-origin traffic. To estimate it — for example, to assess origin load after migrating from a CDN to ESA — use the cache status dimension.
The cache status dimension records whether each request was a cache hit or miss. Requests with a MISS status are back-to-origin requests where ESA retrieves content from the origin. Filter by MISS to estimate back-to-origin traffic and assess origin load.
Use case: Traffic analysis for protection
-
Background: An e-commerce platform owner noticed that website speed dropped during peak hours. Customers reported slow loading and some pages were inaccessible. The owner suspected either a traffic surge or a malicious attack, and cart abandonment increased.
-
Solution: The owner adds the website to ESA and uses traffic analytics in ESA to investigate. In the ESA traffic analytics module, they discover a high volume of abnormal requests from a single IP during peak hours. They then create a WAF custom rule to block that IP.