DNS analytics provides key metric monitoring and traffic statistics reports in the form of visualized analytics with different dimensions. You can adjust service policies based on the real-time monitoring for your website.
What is DNS analytics
With DNS analytics dashboard, you can monitor real-time DNS status for your website based on a predefined set of dimensions.
Data insights
By tracking DNS trends for metrics, you can see changes in website access as well as identify peak and low activity times.
Performance evaluation
You can spot and fix issues by analyzing total queries and processing time to measure how well your content is delivered and how your website performs.
Resource planning
By analyzing DNS data, you can plan bandwidth needs and optimize cache settings to reduce unnecessary traffic.
Check on the dashboard
In the ESA console, choose Websites and click the website name you want to manage.
In the left-side navigation pane, select .
Filter your data by time and other query characteristics.
Optional. Click the
 icon to print the report or the
 icon to download it.
DNS analytics panels
You can see overall metrics, an overview panel, and a top data panel:
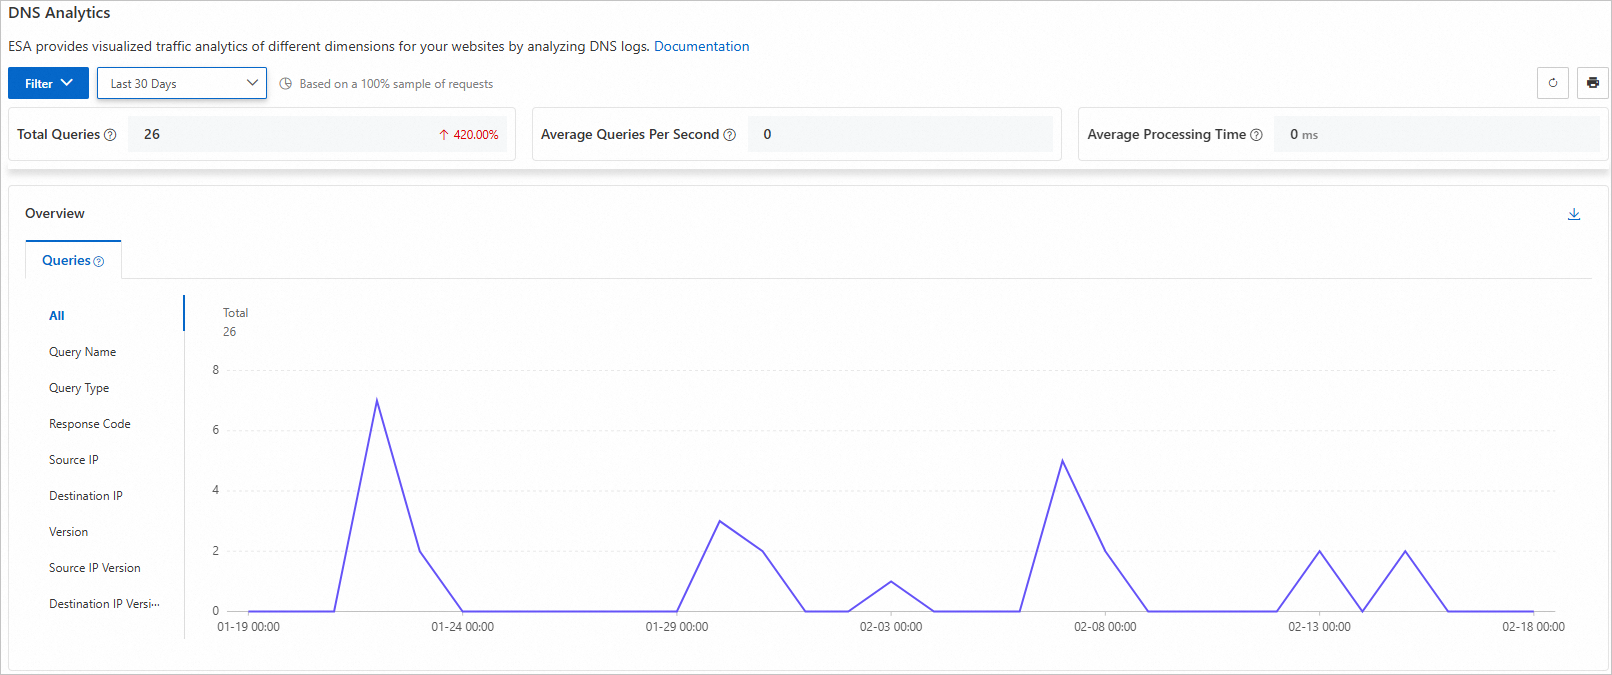
Overall metrics
Total Queries: The total number of DNS queries resolved by ESA.
Average Queries Per Second: The average number of DNS queries resolved by ESA per second.
Average Processing Time: The average time for ESA to process a DNS query.
Metric change: Move the pointer over the arrow beside each metric to see the period-on-period change of each data metric. It is not displayed if no data is available for the previous period.
Overview panel
In the overview panel, you can visualize the number of DNS queries over time through an interactive line chart. This enables you to monitor website performance and identify access trends that matter to you.
The available dimensions are:
Query name
Query type
Response code
Source IP
Destination IP
Version
Source IP version
Destination IP version
Top data panel
You can apply your desired filter to access data for the top five, ten, or fifteen results in the available dimensions:
