After you enable the security log feature, you can log on to the Log Service console to query and analyze the logs, select statistical charts to display the query and analysis results, and save the results to the dashboard. You can also view the built-in statistical reports of Dynamic Route for CDN (DCDN) in the Log Service console. This topic describes how to use the security reports of DCDN in the Log Service console.
Prerequisites
Query the meanings of fields in security logs
After you enable the security log feature, security logs are automatically stored in Log Service. You can query the meanings of log fields in the Logstore in which the logs are stored.
View security reports
DCDN provides built-in security reports in the dcdn-waf-logstore Logstore to help you understand the business risks and protection effects of DCDN. Security reports use the dashboard and chart features provided by Log Service. For more information, see Overview of visualization.
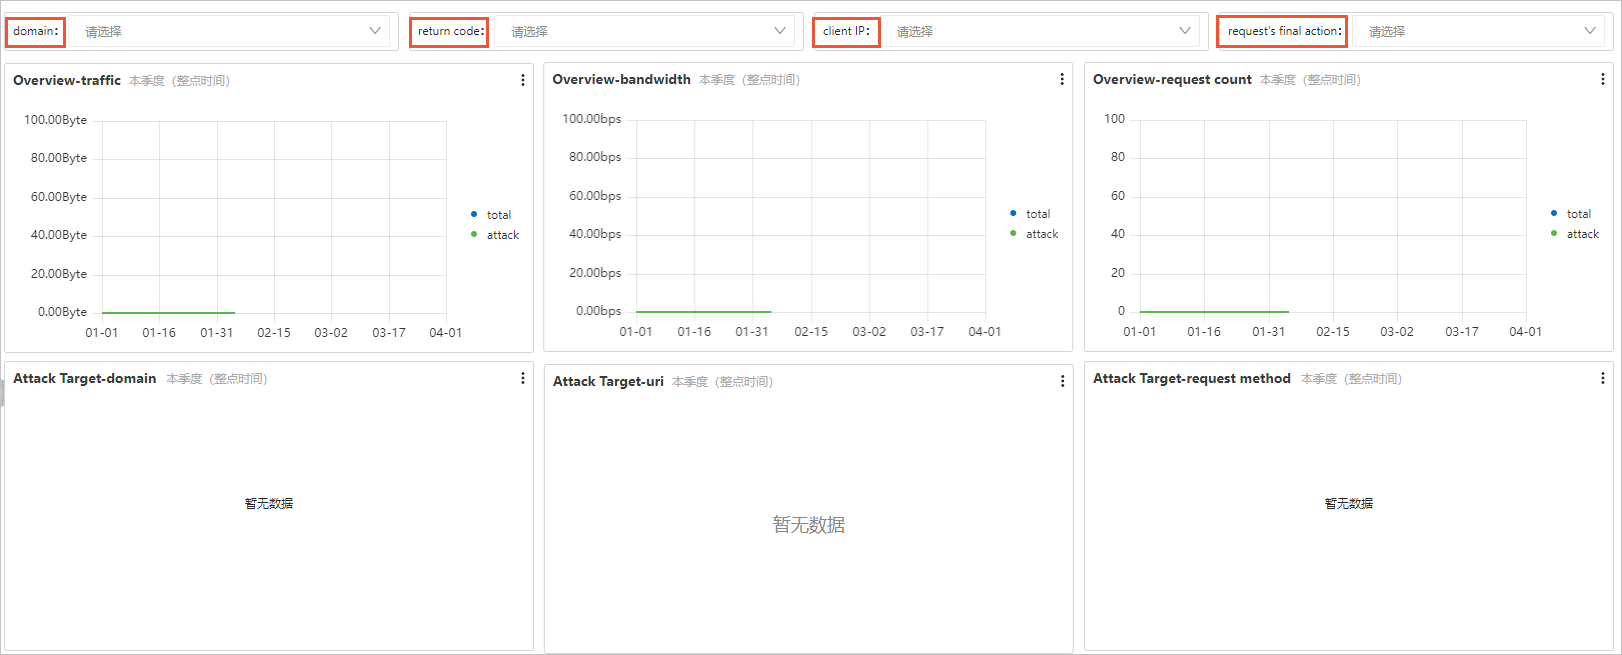
- In the upper part of the report, select values from the domain, return code, Client IP, and request's final action drop-down list to filter log data based on different combinations. Statistical charts
in built-in security reports are automatically updated based on the filtering result.
The following table describes the dimensions from which the built-in security reports display business risk and protection information.
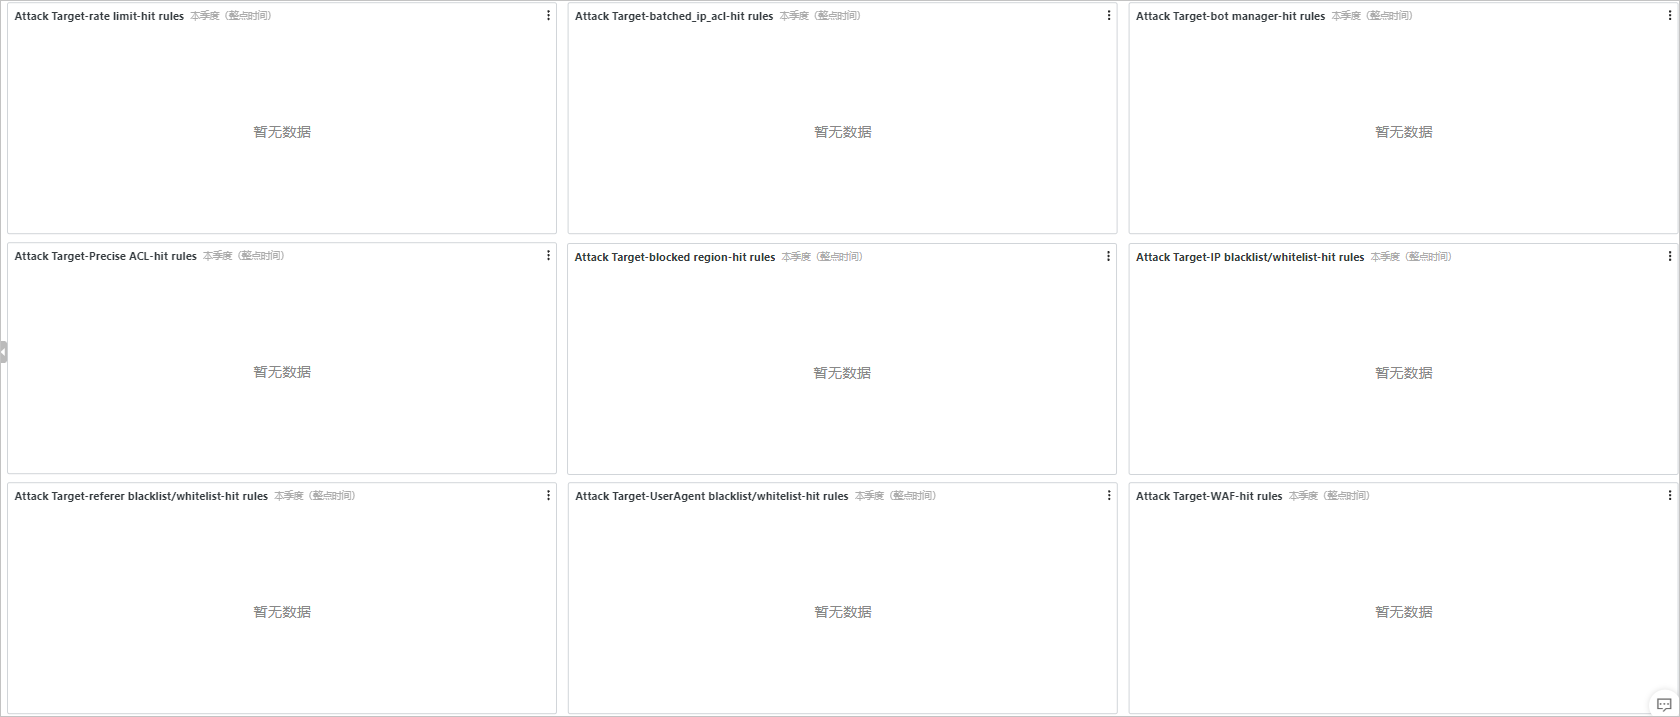
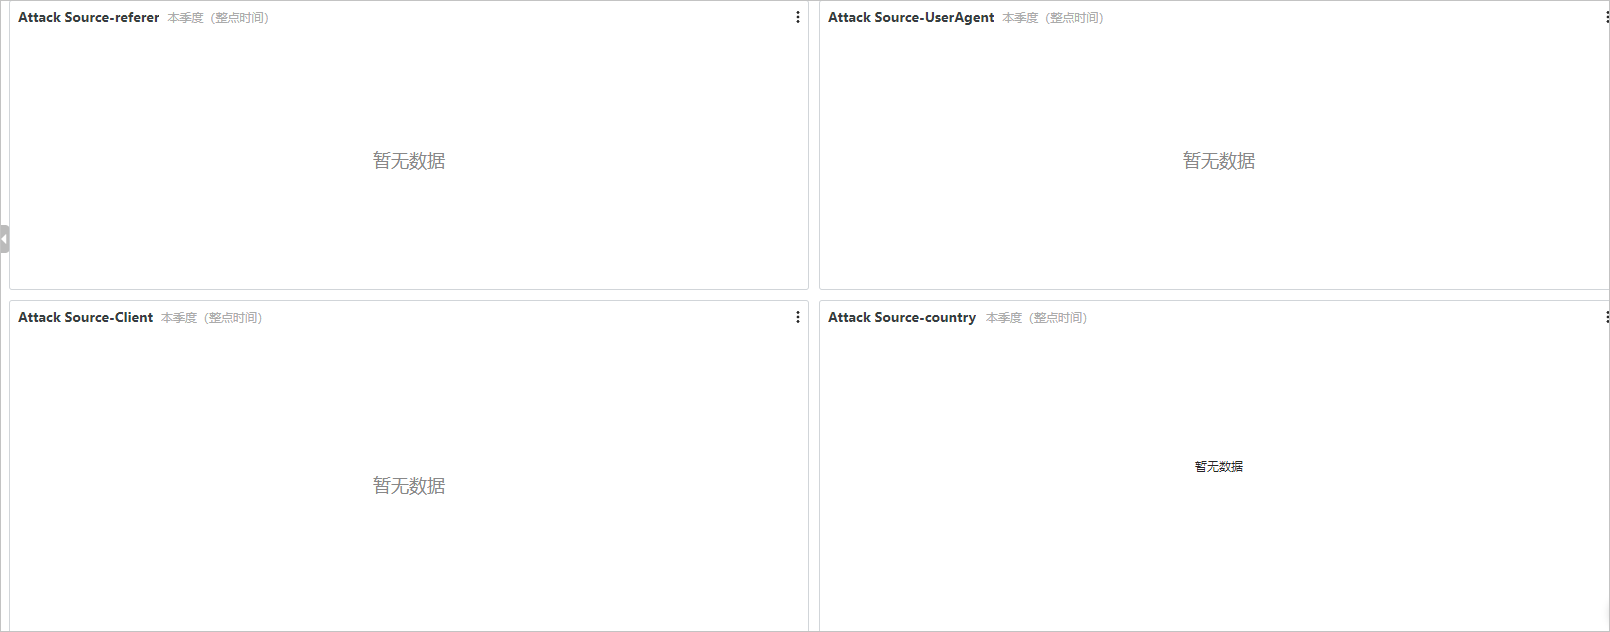
Dimension Chart Result Overview Traffic The traffic data that is collected every 5 minutes is displayed. The traffic is classified into total traffic and attack traffic. Bandwidth The bandwidth data that is collected every 5 minutes is displayed. The bandwidth is classified into total bandwidth and attack bandwidth. Request count The number of requests that are collected every 5 minutes is displayed. The requests are classified into total requests and attack requests. Attack target Domain The domain names are sorted based on the number of attack requests. uri The URIs are sorted in descending order based on the number of attack requests. Request method The attack requests are classified based on HTTP request methods. Hit rules The hit rules of each security module are displayed. The hit rules are sorted in descending order based on the number of hits. Attack source Referer The attack requests are classified based on the Referer header. The distribution of Referers is displayed in a table. The distribution of Referers is sorted in descending order based on the number of interceptions. User-Agent The attack requests are classified based on the User-Agent header. The distribution of user agents (UAs) is displayed in a table. The distribution of UAs is sorted in descending order based on the number of interceptions. Client The client IP addresses are sorted in descending order based on the number of attack requests. The country to which the client IP address belongs is displayed. The number of attack requests that correspond to each security module is separately displayed, and the attack traffic during the query period is collected. Country The attack requests are classified based on the countries to which the client IP addresses belong. The main countries from which attacks are initiated are displayed on a map. The following figure shows the reports.
Overview:
Attack target:
Attack source:
Fields in a security log
| Field | Description | Indexed by default |
|---|---|---|
| client_ip | The real IP address of the client that sent the request. | Yes |
| domain | The domain name to which the request was sent. | Yes |
| method | The request method. | Yes |
| refer_domain | The domain name in the HTTP Referer header. | Yes |
| refer_param | The parameters in the HTTP Referer header. | Yes |
| refer_protocol | The protocol in the HTTP Referer header. | Yes |
| refer_uri | The URI in the HTTP Referer header. | Yes |
| request_size | The size of the request. Unit: byte. | Yes |
| response_size | The size of the response. Unit: byte. | Yes |
| return_code | The HTTP status code that was returned. | Yes |
| scheme | The protocol over which the request was sent. | Yes |
| security_tag | The structure that recorded the information about edge protection.
Note The following table describes the fields of security_tag.
|
Yes |
| unixtime | The timestamp of the request. | Yes |
| uri | The resource that was requested. | Yes |
| uri_param | The request parameters. | Yes |
| user_agent | The information about the proxy of the client. | Yes |
| uuid | The ID of the request. | Yes |
 The following table describes the fields of security_tag.
| Field | Description |
|---|---|
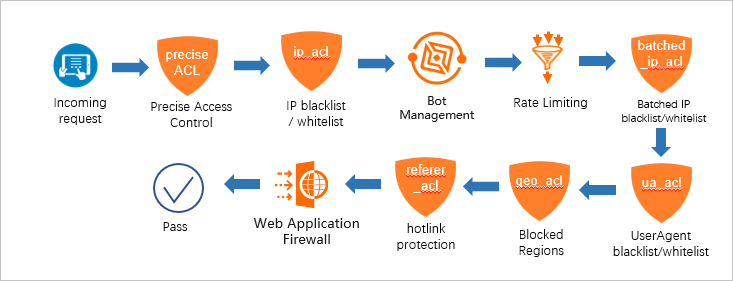
| security_tag.modules | The following security modules are included: Precise Access Control, IP blacklist
/ whitelist, Bot Management, Rate Limiting, Batched IP blacklist/whitelist, UserAgent
blacklist/whitelist, Blocked Regions, hotlink protection, and Web Application Firewall.
Note The information about WAF is displayed in modules only when you set the action of
WAF to block. If the information about WAF is not recorded in the security_tag field,
but you find that the request may be processed by WAF, you can view the access logs
of WAF. For more information, see Query logs.
|
| security_tag.modules.<module_name>.rule | The rule that is triggered in the specified module. You can create custom rules or use the built-in rules. |
| security_tag.modules.<module_name>.action | The action that is performed on the request based on the triggered rule in a module.
Note For more information about the actions that can be performed by a module and the sequence
of actions that are performed, see Actions of each security module.
|
| security_tag.final_action | The final action that is performed on the request. Each module that is hit by the
request performs a specified action. The actions performed by different modules may
vary. The system sorts the actions and sets the final_action field to the action that
has the highest priority. The priority of actions: close > block > delay > captcha
> js > observe > allow > bypass.
Note If a request hits three modules, and the actions of the modules are js, delay, and
allow, the value of final_action is delay based on the sequence of actions delay >
js > allow.
|
| security_tag.block_module | The module that blocks the request. This field is set only when final_action is set to block. |
The following table describes the actions of each security module.
| Security module | Action |
|---|---|
| Precise access control | You can configure block, js, observe, and bypass. js is configured only in the background. |
| IP address blacklist and whitelist | block. |
| Bot management | You can configure allow, observe, js, delay, and block. js and delay are configured only in the background. |
| Rate limiting | You can configure allow, block, js, captcha, delay, and close. captcha, delay, and close are configured only in the background. |
| IP blacklist | block. |
| User-Agent blacklist and whitelist | block. |
| Region blacklist | You can configure block and js. js is configured only in the background. |
| Referer blacklist or whitelist | block. |
| WAF | block. |
- observe: Requests are allowed and recorded in the log. The observe action is performed to evaluate the protection effect of a new rule.
- The object of the allow action is the request, and the object of the bypass action is the security module.