When a Java application running on an Elastic Compute Service (ECS) instance disappears without a graceful shutdown, the cause is one of two things: the Linux kernel killed the process to free memory, or the Java Virtual Machine (JVM) crashed internally. The following sections explain how to diagnose each cause and prevent recurrence. All examples use Linux.
Use the following table to match your symptoms to the most likely cause:
| Symptom | Likely cause | Where to look |
|---|---|---|
| Process gone, no application-level error logs | OOM killer terminated the process | /var/log/messages |
hs_err_<pid>.log file in the JVM working directory | JVM crash | The hs_err log file |
| EDAS alert for abnormal exit | Either cause | ECS instance logs |
Diagnose and resolve OOM killer termination
The Linux kernel enables the OOM killer by default. When physical memory and swap space are nearly exhausted, the OOM killer selects a process to terminate based on a score called oom_score. Each running process has an oom_score stored at /proc/<pid>/oom_score. The higher the score, the more likely the process is to be killed.
When the OOM killer terminates a process, it writes the process ID (PID) and memory details to the operating system logs.
Search the OS logs
Run one of the following commands to find OOM killer entries in /var/log/messages:
grep -i 'killed process' /var/log/messagesFor a broader search that captures both the OOM invocation and the kill event:
egrep "oom-killer|total-vm" /var/log/messagesRead OOM killer log entries
ECS cluster example
The following log shows that the OOM killer terminated process 43805 (keystone-all) with an oom_score of 249:
[Wed Aug 31 16:36:42 2017] Out of memory: Kill process 43805 (keystone-all) score 249 or sacrifice child
[Wed Aug 31 16:36:42 2017] Killed process 43805 (keystone-all) total-vm:4446352kB, anon-rss:4053140kB, file-rss:68kB
[Wed Aug 31 16:56:25 2017] keystone-all invoked oom-killer: gfp_mask=0x280da, order=0, oom_score_adj=0
[Wed Aug 31 16:56:25 2017] keystone-all cpuset=/ mems_allowed=0
[Wed Aug 31 16:56:25 2017] CPU: 2 PID: 88196 Comm: keystone-all Not tainted 3.10.0-327.13.1.el7.x86_64 #1
Key fields:
| Field | Meaning |
|---|---|
Kill process <PID> | The PID of the terminated process |
score <N> | The oom_score at the time of termination |
total-vm | Total virtual memory allocated to the process |
anon-rss | Anonymous resident memory (physical memory used) |
Swarm cluster example
In container environments, OOM kills may come from a memory cgroup limit rather than system-wide memory exhaustion:
Memory cgroup out of memory: Kill process 20911 (beam.smp) score 1001 or sacrifice child
Killed process 20977 (sh) total-vm:4404kB, anon-rss:0kB, file-rss:508kB
The Memory cgroup out of memory message indicates the process exceeded a container-level memory limit, not system-wide memory pressure.Resolve OOM killer issues
Option 1: Increase memory or reduce process memory usage
Either upgrade the ECS instance to a specification with more memory, or reduce the memory footprint of the killed process. For Java applications, check the -Xmx and -Xms JVM heap settings to make sure they fit within the available memory.
A JVM process consumes more memory than the heap alone. The total includes the heap (-Xmx), metaspace (-XX:MetaspaceSize), thread stacks (-Xssper thread), native memory, and JVM overhead. Make sure the sum of all these areas fits within the available physical memory.
Option 2: Mount a swap partition
The OOM killer is often triggered on ECS instances that have no swap partition. Adding a swap partition gives the kernel additional virtual memory before the OOM killer activates.
Swap uses disk I/O and degrades performance. Weigh the trade-off between performance and process stability for your use case.
If no swap partition is mounted, search for instructions on how to create and mount a swap partition in Linux.
Option 3: Protect critical processes with oom_score_adj
You can lower a process's OOM kill priority so the kernel targets other processes first. Set oom_score_adj to a negative value (range: -1000 to 1000; lower values reduce kill priority):
# Reduce the OOM kill priority for a specific process
echo -500 > /proc/<pid>/oom_score_adj
To make the adjustment persistent across restarts, add it to the service configuration or startup script.
Protecting one process increases the likelihood that other processes are killed instead. Use this selectively for mission-critical processes only.
Diagnose and resolve JVM crashes
A JVM process can exit unexpectedly due to:
Invalid Java Native Interface (JNI) calls from native libraries
Native memory (off-heap) exhaustion in C/C++ code
Other fatal JVM errors
Understand JVM memory areas
The JVM uses memory beyond the heap. When total JVM memory exceeds available system memory, the OS may kill the process even if the heap is within limits.
| Memory area | Controlled by | Description |
|---|---|---|
| Heap | -Xms, -Xmx | Object allocations |
| Metaspace | -XX:MetaspaceSize, -XX:MaxMetaspaceSize | Class metadata |
| Thread stacks | -Xss (per thread) | One stack per thread |
| Native memory | No direct JVM flag | Memory used by JNI, native libraries, and direct byte buffers |
| JVM overhead | N/A | Internal JVM bookkeeping |
Locate and analyze the crash log
When the JVM crashes, it generates an error log file named hs_err_<jvm_pid>.log in the working directory of the JVM process.
Find the working directory of the JVM process: Replace
<jvm_pid>with the PID of the crashed JVM process.pwdx <jvm_pid>Open the
hs_err_<jvm_pid>.logfile in that directory. The log contains:The signal or error that caused the crash
The thread that was executing when the crash occurred
A stack trace pointing to the failing code
Memory and system information at the time of the crash
Track native memory usage
If you suspect native (off-heap) memory exhaustion, enable Native Memory Tracking (NMT) to identify which JVM subsystem is consuming memory:
Add the following flags to your JVM startup options:
-XX:NativeMemoryTracking=detail -XX:+UnlockDiagnosticVMOptions -XX:+PrintNMTStatisticsWhile the process is running, query native memory usage: Example output:
   # Find the JVM process ID
   jps

   # Print a native memory summary
   jcmd <pid> VM.native_memory summary
Native Memory Tracking: Total: reserved=1811283KB, committed=543735KB - Java Heap (reserved=393216KB, committed=390656KB) - Class (reserved=1095741KB, committed=54165KB) - Thread (reserved=22290KB, committed=22290KB)(Optional) Enable core dumps for deeper analysis. Core dumps capture the full memory state of the process at the time of the crash, which you can analyze with tools such as
gdb.
Enable abnormal exit analysis in EDAS
Enterprise Distributed Application Service (EDAS) provides built-in monitoring for unexpected JVM exits.
Open the EDAS console and go to the application details page.
Click the Basic Information tab.
In the Application Settings section, enable Analysis of Abnormal Exit.
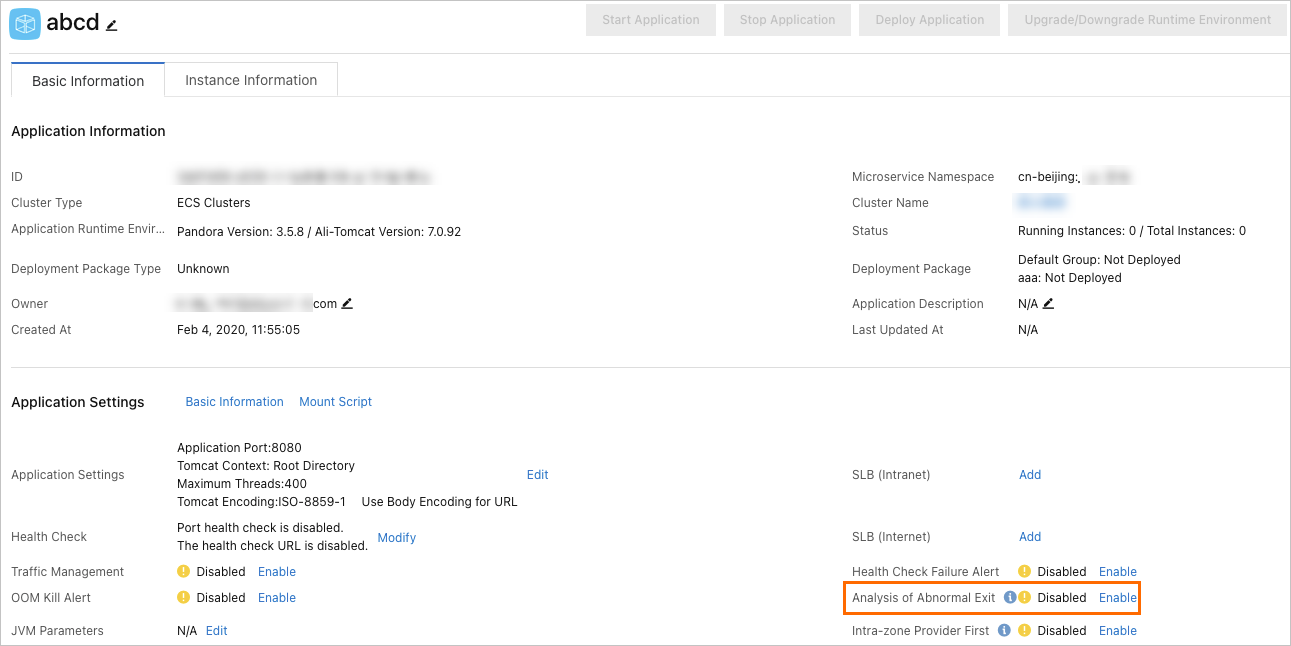
After you enable this feature, EDAS triggers an alert when the JVM process exits unexpectedly (requires the application monitoring and alerting feature to be enabled). When an alert fires, log in to the ECS instance to examine the crash logs and diagnose the root cause.