Enterprise Distributed Application Service (EDAS) records all alert events on the Events page. Use this page to track alert activity across your applications, filter events by name, status, or object, and inspect event details with monitoring data.
Prerequisites
Alert Management is available only for Alibaba Cloud users that activated EDAS after 00:00:00, April 30, 2021.
Open the Events page
Log on to the EDAS console.
In the left-side navigation pane, choose Application Management > Applications.
On the Applications page:
In the top navigation bar, select a region.
From the Microservices Namespace drop-down list, select a microservices namespace.
From the Cluster Type drop-down list, select ECS Clusters.
Click the name of the application that you want to manage.
In the left-side navigation pane, choose Alert Management > Alert Event History.
The Events page lists all alert events for the selected application.
Filter alert events
The Events page displays all alert events, regardless of the status of the alerts. For each event, the page shows event name, notification policy, timestamp, number of events with the same name, status, target object, and object type.
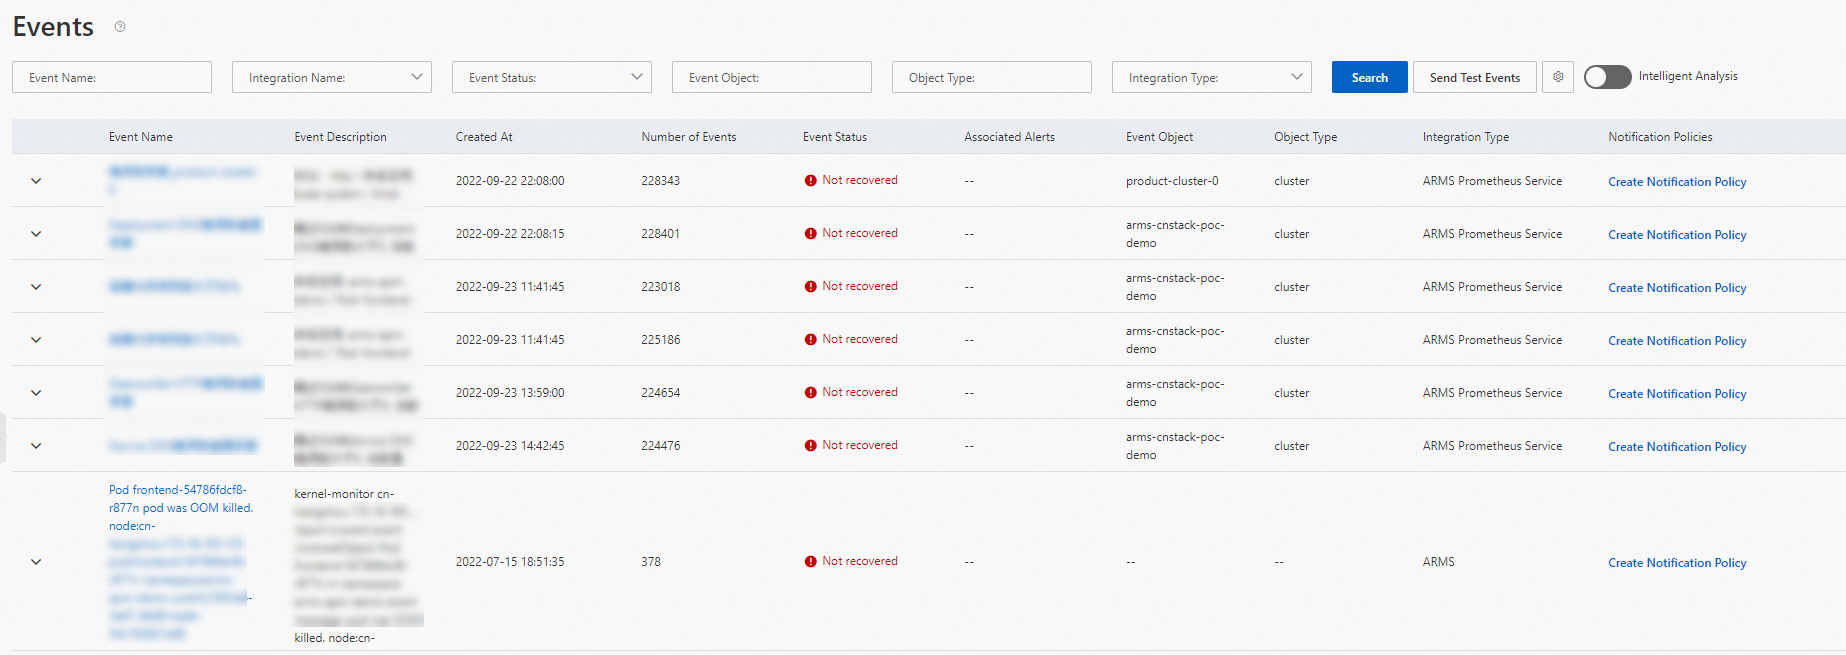
To find specific events, set filter conditions and click Search.
Click the Settings icon to access additional filter options.
The following table describes the available filter parameters.
Parameter | Description |
Event Name | Name of the alert rule that triggered the event. |
Event Status | Current status of the event. Valid values:
|
More | |
Event Object | Name of the monitored object, such as a monitoring task or a cluster. Available under More. |
Object Type | Type of the monitored object, such as browser monitoring, application monitoring, or Prometheus monitoring. Available under More. |
View event details
Click an alert event on the Events page to open its Event Details page. This page displays basic information, monitoring data, and extended fields.
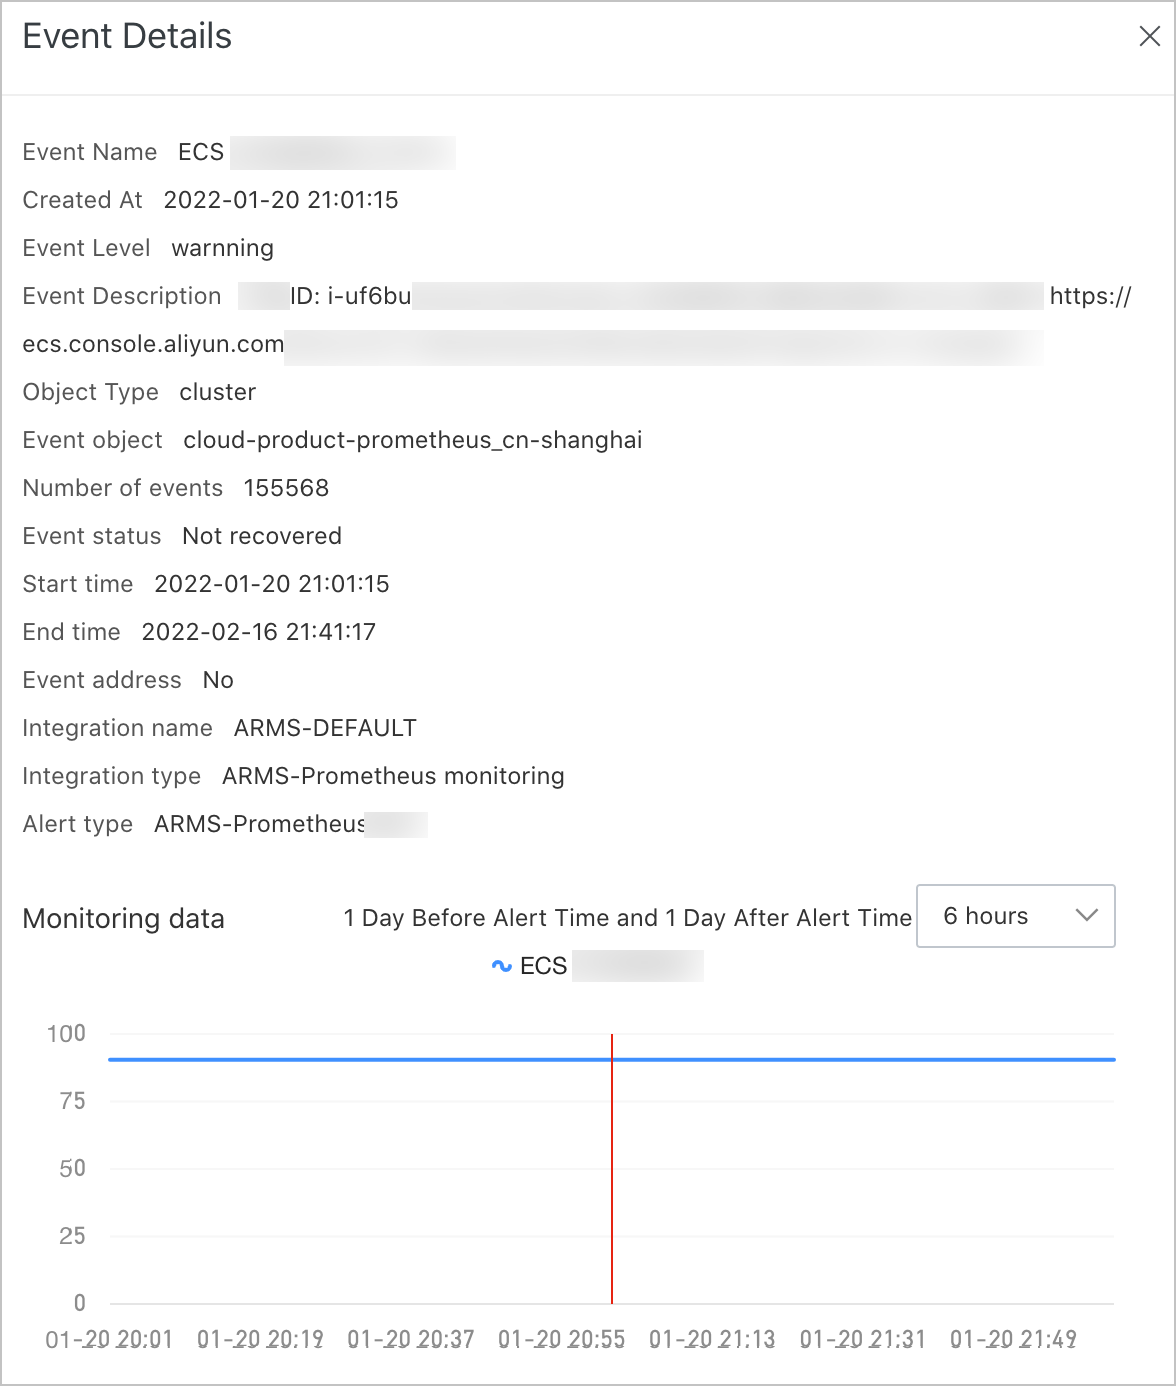
In the Monitoring Data section:
Select a time window from the drop-down list to display data before and after the alert was triggered. Options: 6 hours, 12 hours, or 24 hours.
Click and drag on the chart to zoom into a specific time range. Click Reset to return to the original view.
Send a test alert event
To verify that alerts reach the correct destination, send a test event:
On the Events page, click Send Test Events.
In the dialog box, configure the Integration Name and Event Content parameters.
Click OK.